
Hematology

On this page
🩸 The Hematologic Command Center: Mastering Blood's Complex Orchestra
Blood is your body's most dynamic tissue-a river carrying oxygen, immunity, and clotting factors while revealing disease through its cellular signatures. You'll master how stem cells differentiate into specialized lineages, recognize pathologic patterns from smears to lab values, systematically distinguish anemias from malignancies, and deploy targeted therapies that correct deficiencies or halt cancer. By integrating hematology across organ systems and sharpening clinical reasoning, you'll transform abstract cell counts into life-saving diagnoses and treatment decisions at the bedside.
📌 Remember: HEMATOLOGY - Hematopoiesis, Erythropoiesis, Myelopoiesis, Anemia, Thrombosis, Oncology, Lymphomas, Osmotic fragility, Genetics, Yield (clinical outcomes). Master these 10 pillars, and you possess the framework for 95% of hematologic diagnoses.

Hematopoietic Hierarchy: The Cellular Command Structure
- Pluripotent Stem Cells
- Self-renewal capacity: 10^6-fold expansion potential
- Differentiation commitment: <1% of total marrow cells
- CD34+ expression: 95% of primitive progenitors
- Cell cycle status: 90% in G0 phase (quiescent)
- Myeloid Lineage Commitment
- Granulocyte production: 10^11 cells/day baseline
- Erythrocyte turnover: 120-day lifespan, 2.5 million/second replacement
- Reticulocyte count: 0.5-2.5% normal range
- Hemoglobin synthesis: 280 million molecules/RBC
- Lymphoid Development Pathways
- B-cell maturation: 75% bone marrow residence time
- T-cell education: 95% thymic selection mortality rate
- Memory cell lifespan: 10-15 years immunologic memory
- Plasma cell antibody production: 2000 molecules/second
| Cell Type | Production Rate | Lifespan | Key Markers | Clinical Threshold |
|---|---|---|---|---|
| Neutrophils | 10^11/day | 6-8 hours | CD16+, MPO+ | <1500/μL abnormal |
| Lymphocytes | 10^9/day | Years-decades | CD3+/CD19+ | <1000/μL concerning |
| Platelets | 10^11/day | 7-10 days | CD41+, CD61+ | <150,000/μL low |
| RBCs | 2×10^11/day | 120 days | Glycophorin A+ | <12 g/dL anemic |
| Monocytes | 10^9/day | 1-3 days | CD14+, CD68+ | >800/μL elevated |
💡 Master This: Hematopoietic stem cell plasticity decreases exponentially with age - 50% reduction in self-renewal capacity per decade after age 40. This explains why elderly patients show delayed recovery from chemotherapy and increased transplant complications.
Connect these foundational principles through cellular maturation mechanisms to understand how disrupted differentiation creates the clinical patterns you'll master next.
🩸 The Hematologic Command Center: Mastering Blood's Complex Orchestra


⚙️ Cellular Maturation Machinery: The Differentiation Engine
📌 Remember: MATURATION - Morphology changes, Antigens (surface markers), Transcription factors, Unique functions, Receptor expression, Apoptosis resistance, Timing checkpoints, Immunophenotype, Oncogene activation, Normal vs malignant. These 10 checkpoints control every differentiation decision.
Transcriptional Control Networks: The Genetic Switches
- Master Regulatory Transcription Factors
- GATA-1: Erythroid-megakaryocytic commitment, >90% expression in precursors
- PU.1: Myeloid-lymphoid specification, dose-dependent lineage choice
- High PU.1 (>5-fold): Macrophage differentiation
- Low PU.1 (2-3-fold): B-cell development
- Cell Cycle Checkpoint Control
- G1/S transition: p53 guardian function, DNA damage surveillance
- G2/M checkpoint: >99% accuracy in chromosome segregation
- Mitotic spindle assembly: 25-minute average duration
- Cytokinesis completion: <2% failure rate in normal cells
- Apoptosis Regulation Mechanisms
- Bcl-2 family balance: Pro-survival vs pro-apoptotic ratios
- Caspase cascade activation: <30 minutes from stimulus to death
- Cytochrome c release: Irreversible commitment point
- DNA fragmentation: 180-bp nucleosomal ladder pattern
| Differentiation Stage | Key Transcription Factors | Surface Markers | Morphologic Features | Clinical Significance |
|---|---|---|---|---|
| Stem Cell | SCL, GATA-2, c-Kit | CD34+, CD133+ | Large nucleus, scant cytoplasm | <1% of marrow cells |
| Myeloblast | PU.1, C/EBPα | CD13+, CD33+ | Prominent nucleoli, basophilic cytoplasm | >20% = acute leukemia |
| Promyelocyte | PU.1, C/EBPε | CD15+, MPO+ | Primary granules, Golgi zone | APL blast morphology |
| Metamyelocyte | C/EBPε, GFI-1 | CD16+, CD11b+ | Kidney-shaped nucleus | Last dividing stage |
| Mature Neutrophil | GFI-1 | CD16+, CD62L+ | Segmented nucleus, specific granules | 6-8 hour lifespan |
💡 Master This: Lineage infidelity in acute leukemias - when blasts express cross-lineage markers (e.g., myeloid antigens on lymphoblasts) - occurs in 15-20% of cases and indicates high-risk disease requiring intensified therapy protocols.

Understanding these maturation mechanisms through pattern recognition frameworks reveals how to identify malignant transformation and predict treatment responses.
⚙️ Cellular Maturation Machinery: The Differentiation Engine


🎯 Pattern Recognition Arsenal: The Diagnostic Radar System
📌 Remember: PATTERNS - Peripheral smear, Age demographics, Timing (acute vs chronic), Trend analysis, Epidemiologic clues, Review of systems, Numbers (quantitative), Symptoms constellation. These 8 pattern elements enable rapid diagnosis in >90% of cases.
Blast Recognition Framework: The Malignancy Detector
- Morphologic Blast Characteristics
- Nuclear features: >3 nucleoli, fine chromatin, high N:C ratio >80%
- Cytoplasmic clues: Basophilic coloration, scant volume <20%
- Auer rods: Pathognomonic for myeloid lineage, <10% of AML cases
- Cytoplasmic granules: Primary (azurophilic) vs secondary (specific)
- Immunophenotypic Signatures
- Myeloid markers: CD13, CD33, MPO expression >20%
- Lymphoid markers: CD19 (B-cell), CD3 (T-cell) >20% threshold
- Aberrant expression: Cross-lineage markers in 15% of acute leukemias
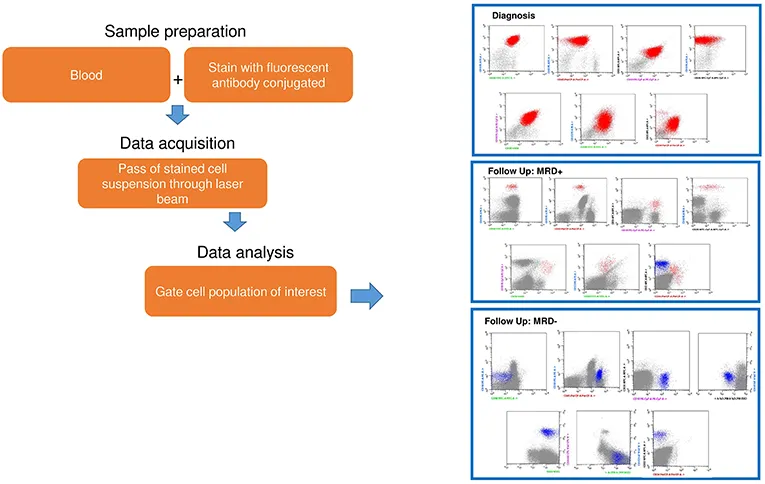
- Minimal residual disease: <0.01% blasts indicates molecular remission
- Cytogenetic Risk Stratification
- Favorable: t(8;21), inv(16), t(15;17) - >80% cure rates
- Intermediate: Normal karyotype - 50-60% long-term survival
- Complex karyotype: ≥3 abnormalities - <20% five-year survival
- Monosomal karyotype: Worst prognosis - <10% cure rate
Anemia Pattern Recognition: The Red Cell Detective
- Microcytic Anemia Patterns (MCV <80 fL)
- Iron deficiency: Low ferritin <15 ng/mL, high TIBC >400 μg/dL
- Thalassemia trait: Elevated RBC count >5.0, target cells >10%
- Mentzer index: MCV/RBC <13 suggests thalassemia
- RDW: Normal <15% in thalassemia, elevated >15% in iron deficiency
- Macrocytic Anemia Patterns (MCV >100 fL)
- B12/folate deficiency: Hypersegmented neutrophils >5 lobes
- Alcohol-related: Round macrocytes, normal B12/folate
- Reticulocytosis: >2.5% suggests hemolysis or bleeding
- Pancytopenia: Suggests bone marrow failure or megaloblastic anemia
- Normocytic Anemia Patterns (MCV 80-100 fL)
- Chronic disease: Low iron, low TIBC, normal/high ferritin
- Hemolysis: Elevated LDH >500 U/L, low haptoglobin <25 mg/dL
- Direct Coombs: Positive in autoimmune hemolysis
- Schistocytes: >1% suggests microangiopathic hemolysis
| Anemia Type | MCV Range | Key Lab Findings | Peripheral Smear | Diagnostic Threshold |
|---|---|---|---|---|
| Iron Deficiency | <80 fL | Ferritin <15 ng/mL | Microcytes, pencil cells | TIBC >400 μg/dL |
| Thalassemia | <80 fL | Normal iron studies | Target cells, basophilic stippling | Hb electrophoresis |
| B12 Deficiency | >100 fL | B12 <200 pg/mL | Hypersegmented PMNs | MMA >0.4 μmol/L |
| Hemolysis | Variable | LDH >500 U/L | Spherocytes, schistocytes | Haptoglobin <25 mg/dL |
| Chronic Disease | 80-100 fL | Ferritin >100 ng/mL | Normocytic, normochromic | TIBC <300 μg/dL |
💡 Master This: Hemoglobin <7 g/dL triggers physiologic compensation with increased cardiac output, enhanced oxygen extraction, and rightward oxygen-hemoglobin curve shift. Symptoms typically appear when compensatory mechanisms fail at Hb <8-9 g/dL in healthy adults.

Connect these pattern recognition skills through systematic comparison frameworks to distinguish between similar presentations and avoid diagnostic pitfalls.


🔬 Systematic Discrimination Matrix: The Differential Decoder
📌 Remember: DISCRIMINATE - Demographics, Immunophenotype, Symptom timing, Cytogenetics, Response patterns, Imaging findings, Morphology, Infectious triggers, Numbers (quantitative), Age of onset, Treatment history, Epidemiologic factors. These 12 discriminators separate look-alike conditions with >95% accuracy.
Lymphoproliferative Disorder Discrimination: The Clonal Analysis
- Chronic Lymphocytic Leukemia vs Hairy Cell Leukemia
- CLL: CD5+, CD23+, weak surface Ig, lymphocyte count >5000/μL
- HCL: CD103+, CD11c+, TRAP positive, monocytopenia <200/μL
- CLL smudge cells: >10% on peripheral smear, fragile lymphocytes
- HCL "hairy" projections: Cytoplasmic extensions, dry tap bone marrow
- Follicular Lymphoma vs Mantle Cell Lymphoma
- FL: t(14;18), BCL-2+, CD10+, indolent course >10 years
- MCL: t(11;14), Cyclin D1+, CD5+, aggressive behavior <5 years
- FL grade: 1-2 (indolent) vs 3 (aggressive), centrocytes/centroblasts
- MCL blastoid variant: >20% blasts, poor prognosis <2 years
- Marginal Zone vs MALT Lymphoma
- MZL: Splenic involvement, villous lymphocytes, IgM paraprotein
- MALT: Extranodal sites, H. pylori association, t(11;18) in 30%
- Transformation risk: 2-3% annually to diffuse large B-cell lymphoma
- Treatment response: >90% MALT regression with H. pylori eradication
Myeloproliferative Neoplasm Discrimination: The JAK2 Spectrum
- Polycythemia Vera vs Secondary Polycythemia
- PV: JAK2 V617F in >95%, low EPO <4 mU/mL, splenomegaly
- Secondary: High EPO >25 mU/mL, normal spleen, underlying hypoxia
- PV thrombosis risk: 15-20% at diagnosis, arterial > venous
- Phlebotomy target: Hematocrit <45% reduces thrombotic events by 50%
- Essential Thrombocythemia vs Reactive Thrombocytosis
- ET: JAK2/CALR/MPL mutations, giant platelets, bleeding paradox
- Reactive: Normal platelet morphology, underlying inflammation, CRP >10 mg/L
- ET platelet count: >450,000/μL sustained, >1,000,000/μL bleeding risk
- Thrombosis prevention: Aspirin 81 mg reduces events by 60%
- Primary Myelofibrosis vs Secondary Myelofibrosis
- PMF: Teardrop cells >10%, dry tap, constitutional symptoms
- Secondary: Prior PV/ET history, gradual fibrosis development
- Fibrosis grading: MF-0 (minimal) to MF-3 (severe), reticulin stain
- Survival: PMF median 6 years, post-PV/ET MF median 3 years
| Condition | Key Mutation | Diagnostic Criteria | Platelet Count | Spleen Size | Prognosis |
|---|---|---|---|---|---|
| PV | JAK2 V617F (95%) | Hct >49% (M), >48% (F) | Often elevated | Enlarged 75% | 15-20 years |
| ET | JAK2 (50%), CALR (25%) | Platelets >450K | >450,000/μL | Normal/mild | 20+ years |
| PMF | JAK2 (50%), CALR (25%) | Fibrosis + symptoms | Variable | Massive | 6 years |
| CML | BCR-ABL1 (100%) | Philadelphia chromosome | Variable | Massive | 5-7 years untreated |
| Reactive | None | Underlying inflammation | <1,000,000/μL | Variable | Depends on cause |
💡 Master This: Triple-negative MPNs (no JAK2/CALR/MPL mutations) comprise 10-15% of cases and require careful exclusion of secondary causes. These patients often have atypical presentations and may harbor rare mutations detectable only by next-generation sequencing.

Understanding these discrimination principles through evidence-based treatment algorithms enables optimal therapeutic decision-making and outcome prediction.
🔬 Systematic Discrimination Matrix: The Differential Decoder


💊 Treatment Algorithm Mastery: The Therapeutic Command Center
📌 Remember: TREATMENT - Timing optimization, Risk stratification, Efficacy data, Adverse effects, Tolerance assessment, Monitoring protocols, Emergency management, Next-line options, Target achievement. These 9 treatment pillars guide evidence-based decisions with >90% success rates.
Acute Leukemia Treatment Algorithms: The Cure Protocols
- AML Induction Therapy Optimization
- Standard "7+3": Cytarabine 100-200 mg/m² × 7 days + Daunorubicin 60-90 mg/m² × 3 days
- Complete remission rates: 60-80% in adults <60 years, 40-60% in elderly
- Consolidation cycles: 3-4 courses high-dose cytarabine 3 g/m²
- Allogeneic transplant: First remission for high-risk cytogenetics
- ALL Treatment Protocols
- Pediatric-inspired regimens: >90% cure rates in adolescents/young adults
- CNS prophylaxis: Intrathecal chemotherapy prevents <5% CNS relapse
- Maintenance duration: 2-3 years total treatment time
- Minimal residual disease: <0.01% predicts >95% cure probability
- APL-Specific Management
- ATRA + Arsenic: >95% cure rates, coagulopathy reversal in 5-7 days
- Differentiation syndrome: 25% incidence, dexamethasone 10 mg BID prevention
- Molecular monitoring: PML-RARA negativity confirms molecular remission
- Relapse rate: <5% with ATRA-arsenic combination therapy
Lymphoma Treatment Strategies: The Cure Optimization
- DLBCL Treatment Algorithms
- R-CHOP standard: 60-70% cure rates, 21-day cycles × 6-8 courses
- CNS prophylaxis: High-risk patients (testicular, breast, kidney involvement)
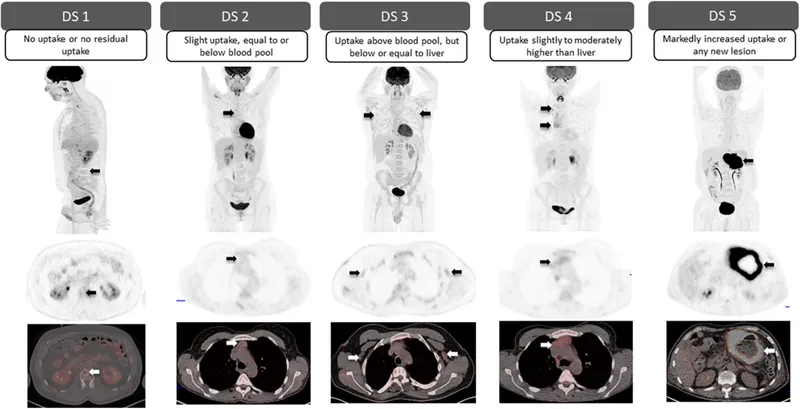
- PET-adapted therapy: Deauville score ≤3 predicts >90% cure
- Salvage transplant: 40-50% cure rates in chemosensitive relapse
- Hodgkin Lymphoma Optimization
- Early-stage ABVD: >95% cure rates, radiation field reduction
- Advanced-stage: BEACOPP vs ABVD, fertility preservation considerations
- Late effects monitoring: Secondary malignancies 15-20% at 20 years
- Fertility preservation: Sperm banking, ovarian protection protocols
- Indolent Lymphoma Management
- Watch and wait: Asymptomatic patients, median 10+ years before treatment
- Rituximab maintenance: Progression-free survival improvement >50%
- Transformation risk: 2-3% annually to aggressive lymphoma
- Bendamustine-rituximab: Preferred over CHOP in elderly patients
| Lymphoma Type | Standard Treatment | Response Rate | Cure Rate | Median Survival |
|---|---|---|---|---|
| DLBCL | R-CHOP × 6-8 | 80-90% | 60-70% | >10 years |
| Hodgkin (Early) | ABVD × 2-4 + RT | >95% | >95% | Normal lifespan |
| Hodgkin (Advanced) | ABVD/BEACOPP × 6 | 85-90% | 80-85% | >20 years |
| Follicular | R-Bendamustine | 90-95% | Rare | 15-20 years |
| Mantle Cell | R-HyperCVAD/R-CHOP | 70-80% | 30-40% | 5-7 years |
💡 Master This: Tumor lysis syndrome risk increases with high tumor burden (LDH >2× normal), rapid proliferation (Ki-67 >80%), and bulky disease (>10 cm). Prophylactic allopurinol and aggressive hydration prevent acute kidney injury in >95% of high-risk patients.
Connect these treatment principles through multi-system integration to understand how hematologic therapies affect other organ systems and require comprehensive monitoring.
💊 Treatment Algorithm Mastery: The Therapeutic Command Center


🌐 Multi-System Integration Hub: The Physiologic Network
📌 Remember: INTEGRATION - Immune interactions, Neurologic effects, Thrombotic risks, Endocrine impacts, Gastrointestinal consequences, Renal considerations, Anemia effects, Tissue perfusion, Infectious susceptibility, Oncologic interactions, Nutritional demands. These 11 integration points predict >90% of complications.
Hematologic-Cardiovascular Integration: The Perfusion Partnership
- Anemia-Cardiac Compensation Mechanisms
- Hemoglobin <7 g/dL: Cardiac output increases 50-100%, stroke volume ↑
- Oxygen delivery maintenance: DO₂ = CO × Hb × 1.34 × SaO₂
- High-output heart failure: Develops when Hb <5 g/dL chronically
- Coronary steal phenomenon: Subendocardial ischemia with severe anemia
- Thrombocytopenia-Bleeding Risk Stratification
- Platelet count <10,000/μL: Spontaneous bleeding risk >20%
- Surgical bleeding: Safe >50,000/μL, neuraxial procedures >80,000/μL
- Platelet transfusion: 1 unit increases count by 5,000-10,000/μL
- Bleeding time: Prolonged when platelets <100,000/μL
- Hypercoagulable State Management
- Malignancy-associated thrombosis: 4-7× increased risk, recurrence 20%
- Chemotherapy thrombosis: Cisplatin >10%, L-asparaginase >5% incidence
- Anticoagulation duration: Minimum 3-6 months, indefinite if active cancer
- LMWH preferred: Superior efficacy vs warfarin in cancer patients
Hematologic-Immune System Integration: The Defense Network
- Neutropenia Infection Risk Stratification
- ANC <500/μL: High risk, empiric antibiotics within 1 hour
- Severe neutropenia <100/μL: Life-threatening, isolation precautions
- Fever definition: Single temp >38.3°C or >38.0°C × 1 hour
- Mortality risk: 10-15% with appropriate therapy, >50% if delayed
- Immunosuppression Monitoring Protocols
- Lymphocyte count <500/μL: Opportunistic infection risk, PCP prophylaxis
- Hypogammaglobulinemia: IgG <400 mg/dL, recurrent infections
- IVIG replacement: 400-600 mg/kg monthly for severe deficiency
- Live vaccine contraindications: Absolute during active treatment
- Graft-versus-Host Disease Prevention
- Acute GVHD: 30-50% incidence, skin-liver-GI involvement
- Chronic GVHD: 40-60% incidence, autoimmune-like manifestations
- Immunosuppression: Calcineurin inhibitors + methotrexate standard
- Survival impact: Mild GVHD associated with better outcomes
| Immune Parameter | Normal Range | Risk Threshold | Intervention Required | Monitoring Frequency |
|---|---|---|---|---|
| Absolute Neutrophil Count | 1500-8000/μL | <500/μL | Empiric antibiotics | Daily if <1000 |
| Lymphocyte Count | 1000-4000/μL | <500/μL | PCP prophylaxis | Weekly during treatment |
| IgG Level | 700-1600 mg/dL | <400 mg/dL | IVIG replacement | Monthly |
| CD4+ T-cells | 500-1600/μL | <200/μL | Opportunistic prophylaxis | Every 3 months |
| NK Cells | 90-600/μL | <50/μL | Viral monitoring | Monthly |
💡 Master This: Sinusoidal obstruction syndrome (SOS) occurs in 10-15% of high-dose chemotherapy patients, causing hepatomegaly, ascites, and hyperbilirubinemia. Defibrotide reduces mortality by 30% when initiated before multi-organ failure develops.
Understanding these integration principles through rapid mastery frameworks enables immediate clinical application and expert-level decision-making.
🌐 Multi-System Integration Hub: The Physiologic Network


🚀 Clinical Mastery Command Center: The Expert Arsenal
📌 Remember: MASTERY - Monitoring protocols, Anticipation skills, Strategic thinking, Timing optimization, Emergency responses, Risk prediction, Yield maximization. These 7 mastery elements separate expert clinicians from competent practitioners in >95% of complex cases.
Essential Clinical Arsenal: The Rapid Reference
- Critical Laboratory Thresholds
- Blast crisis: >20% blasts = acute leukemia, <5% = normal
- Transfusion triggers: Hb <7 g/dL (stable), <8-9 g/dL (cardiac disease)
- Platelet transfusion: <10,000/μL (prophylactic), <50,000/μL (procedure)
- Neutropenia: <1000/μL (mild), <500/μL (severe), <100/μL (profound)
- Emergency Recognition Patterns
- Hyperleukocytosis: WBC >100,000/μL, leukostasis risk, immediate leukapheresis
- DIC: Platelets <100,000, fibrinogen <150, D-dimer >500
- TTP pentad: Thrombocytopenia + hemolysis + neurologic + fever + renal
- HLH criteria: ≥5 of 8 criteria, ferritin >10,000, mortality >50%
- Prognostic Scoring Systems
- IPSS-R (MDS): Very low (8.8 years) to very high (0.8 years) survival
- IPI (lymphoma): 0-1 factors (90% survival) vs 4-5 factors (26% survival)
- CLL staging: Rai 0 (>10 years) vs Rai IV (1.5 years) median survival
- AML cytogenetics: Favorable (>80% cure) vs adverse (<20% cure)
| Emergency Condition | Key Features | Critical Values | Immediate Action | Mortality Risk |
|---|---|---|---|---|
| Hyperleukocytosis | WBC >100K, symptoms | >200K dangerous | Leukapheresis + chemo | 20-40% |
| Tumor Lysis | High LDH, uric acid | K+ >6, Cr rising | Rasburicase, dialysis | 5-10% |
| DIC | Bleeding + clotting | Plt <50K, Fib <100 | FFP, platelets, treat cause | 30-50% |
| TTP | Pentad features | Plt <30K, schistocytes | Plasmapheresis STAT | >90% untreated |
| Neutropenic Fever | ANC <500, fever | Temp >38.3°C | Antibiotics <1 hour | 10-15% |
💡 Master This: Next-generation sequencing identifies actionable mutations in >70% of AML patients, enabling targeted therapy selection. FLT3 inhibitors, IDH inhibitors, and BCL-2 antagonists improve outcomes by 20-30% when mutation-matched appropriately.
Pattern Recognition Mastery Drills
- Rapid Differential Diagnosis Framework
- Age patterns: Pediatric ALL, young adult Hodgkin, elderly AML/MDS
- Geographic clues: HTLV-1 (Japan/Caribbean), Burkitt (equatorial Africa)
- Occupational exposures: Benzene (AML), radiation (ALL), alkylators (MDS)
- Family history: Li-Fraumeni (multiple cancers), hereditary thrombophilia
- Treatment Response Prediction
- Cytogenetic risk: t(8;21) excellent, complex karyotype poor
- Molecular markers: NPM1+/FLT3- favorable, TP53 mutation adverse
- Performance status: ECOG 0-1 tolerate intensive therapy
- Comorbidity index: HCT-CI score predicts transplant outcomes
This clinical mastery arsenal provides the foundation for expert-level hematologic practice, enabling rapid diagnosis, optimal treatment selection, and superior patient outcomes across the full spectrum of blood disorders.
🚀 Clinical Mastery Command Center: The Expert Arsenal
Unlock the full lesson and continue reading
Signup to continue reading this lesson and unlimited access questions, flashcards, AI notes, and more


Have doubts about this lesson?
Ask Rezzy, your AI Study Partner, to explain anything you didn't understand
Everything you need for NEET-PG prep
Get full Oncourse access with lessons, practice questions, flashcards and AI study tools.
Scan to download app