
Nutrition and Health

On this page
🍎 Nutritional Foundations: The Metabolic Architecture
Every cell in your body depends on the precise delivery of nutrients to fuel reactions, build structures, and maintain homeostasis-yet nutritional disorders remain among the most underdiagnosed conditions in clinical practice. You'll master how macronutrients power metabolic pathways, recognize the subtle presentations of deficiency states before they become irreversible, and deploy evidence-based interventions that restore physiologic balance. This lesson builds your expertise from biochemical foundations through systematic clinical assessment, equipping you to identify nutritional dysfunction across organ systems and translate complex metabolic science into targeted therapeutic action.
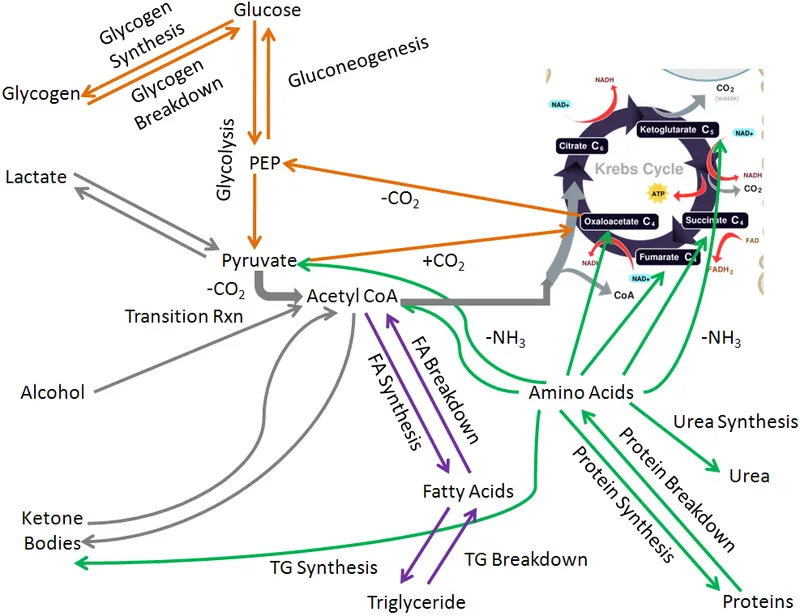
Nutrition forms the cornerstone of human physiology, providing the essential building blocks for cellular function, growth, and repair. The human body requires 6 major nutrient categories: carbohydrates, proteins, fats, vitamins, minerals, and water. Each serves distinct metabolic roles while interconnecting through complex biochemical networks.
📌 Remember: CHOP-VM - Carbohydrates, Healthy fats, Optimal proteins, Vitamins, Minerals (+ Water). These six pillars support every cellular process from ATP synthesis to immune function.
Energy metabolism follows precise quantitative relationships. Carbohydrates yield 4 kcal/g, proteins provide 4 kcal/g, while fats deliver 9 kcal/g - making fats the most energy-dense macronutrient. Alcohol contributes 7 kcal/g but lacks essential nutrients, earning the designation "empty calories."
- Macronutrient Distribution
- Carbohydrates: 45-65% of total daily energy
- Proteins: 10-35% of total daily energy
- Complete proteins: contain all 9 essential amino acids
- Incomplete proteins: lacking one or more essential amino acids
- Fats: 20-35% of total daily energy
- Saturated fats: <10% of total energy
- Trans fats: <1% of total energy
⭐ Clinical Pearl: The Thermic Effect of Food (TEF) varies by macronutrient - protein increases metabolic rate by 20-30%, carbohydrates by 5-10%, and fats by only 0-3%. This explains protein's role in weight management.
| Nutrient Class | Energy Density | Primary Function | Daily Requirement | Clinical Significance |
|---|---|---|---|---|
| Carbohydrates | 4 kcal/g | Immediate energy | 130g minimum | Brain requires 120g glucose daily |
| Proteins | 4 kcal/g | Structure/enzymes | 0.8g/kg body weight | Positive nitrogen balance |
| Fats | 9 kcal/g | Energy storage/hormones | 20-35% total energy | Essential fatty acid provision |
| Water | 0 kcal/g | Transport/temperature | 35ml/kg body weight | Dehydration at 2% body weight loss |
| Vitamins | 0 kcal/g | Cofactors/antioxidants | Variable by vitamin | Deficiency diseases preventable |
| Minerals | 0 kcal/g | Structure/electrolytes | Variable by mineral | Homeostatic regulation critical |
Micronutrients function as metabolic catalysts despite minimal quantity requirements. Fat-soluble vitamins (A, D, E, K) require dietary fat for absorption and can accumulate to toxic levels. Water-soluble vitamins (B-complex, C) need regular replenishment due to urinary losses.
📌 Remember: Fat-soluble = ADEK (store in liver/adipose), Water-soluble = B-Complex + C (daily replacement needed). This storage difference determines supplementation strategies and toxicity risks.
Essential minerals divide into macrominerals (needed >100mg daily) and trace elements (needed <100mg daily). Calcium, phosphorus, magnesium, sodium, potassium, chloride, and sulfur comprise the macrominerals. Iron, zinc, copper, manganese, iodine, selenium, chromium, and molybdenum represent key trace elements.
⭐ Clinical Pearl: Bioavailability varies dramatically - heme iron absorption reaches 15-35% while non-heme iron achieves only 2-20%. Vitamin C enhances non-heme iron absorption by 3-4 fold, explaining combination recommendations.
Understanding these nutritional foundations provides the framework for analyzing dietary patterns, identifying deficiencies, and designing therapeutic interventions that optimize metabolic function across diverse clinical scenarios.
🍎 Nutritional Foundations: The Metabolic Architecture


⚡ Metabolic Powerhouse: Energy Systems in Action
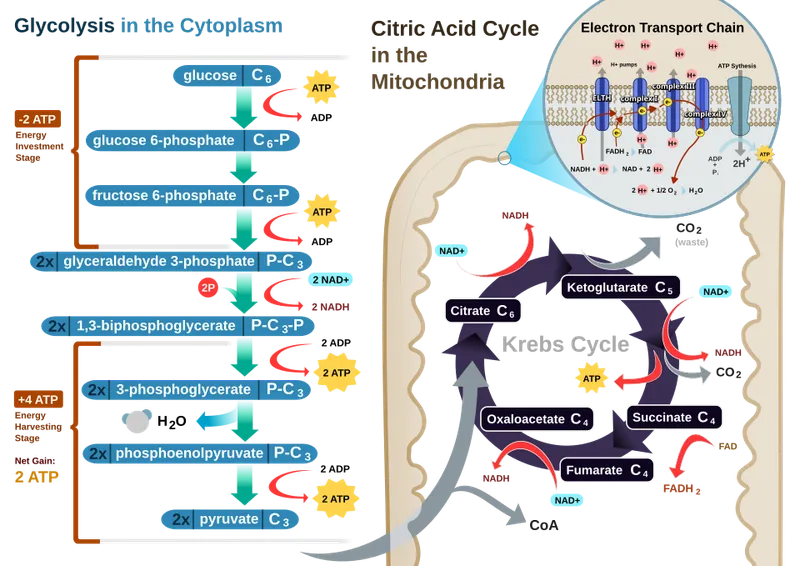
Energy metabolism operates through three integrated systems: immediate energy (phosphocreatine), short-term energy (glycolysis), and long-term energy (oxidative phosphorylation). Each system activates based on exercise intensity, duration, and substrate availability.
📌 Remember: PCG-O - Phosphocreatine (0-10 seconds), Glycolysis (10 seconds-2 minutes), Oxidative (2+ minutes). These systems overlap but dominate at different time intervals during physical activity.
The Respiratory Quotient (RQ) reveals substrate utilization patterns. Pure carbohydrate oxidation yields RQ = 1.0, pure fat oxidation produces RQ = 0.7, and pure protein oxidation generates RQ = 0.8. Mixed substrate utilization typically shows RQ = 0.85.
- Energy System Characteristics
- Phosphocreatine System
- Duration: 0-10 seconds
- Power output: Highest (immediate)
- Fatigue: Minimal (no metabolic byproducts)
- Glycolytic System
- Duration: 10 seconds - 2 minutes
- Power output: High (rapid ATP synthesis)
- Fatigue: Moderate (lactate accumulation)
- Anaerobic threshold: 4 mmol/L lactate
- Oxidative System
- Duration: 2+ minutes
- Power output: Moderate (sustainable)
- Fatigue: Low (efficient ATP production)
- Phosphocreatine System
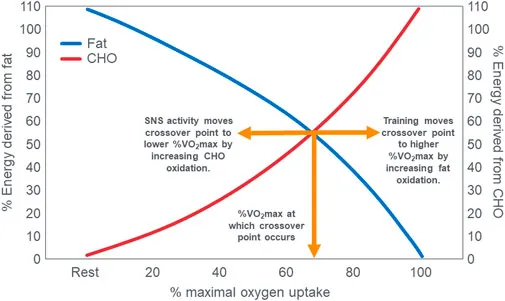
⭐ Clinical Pearl: Metabolic flexibility - the ability to switch between glucose and fat oxidation - deteriorates in metabolic syndrome. Healthy individuals show 50% fat oxidation at rest, while insulin-resistant patients may show <20%.
| Energy System | Primary Fuel | ATP Yield | Oxygen Required | Clinical Application |
|---|---|---|---|---|
| Phosphocreatine | Creatine phosphate | 1 ATP/PCr | No | Explosive movements |
| Glycolysis | Glucose/Glycogen | 2-3 ATP/glucose | No | High-intensity exercise |
| Oxidative | Glucose/Fat/Protein | 36-38 ATP/glucose | Yes | Endurance activities |
| Fat Oxidation | Fatty acids | 147 ATP/palmitate | Yes | Prolonged exercise |
| Protein Oxidation | Amino acids | Variable | Yes | Starvation states |
Metabolic rate varies significantly based on body composition, age, sex, and activity level. Basal Metabolic Rate (BMR) represents energy expenditure at complete rest, typically 60-75% of total daily energy expenditure. Thermic Effect of Activity (TEA) contributes 15-30%, while Thermic Effect of Food (TEF) adds 8-15%.
📌 Remember: BMR-TEA-TEF-NEAT - Basal Metabolic Rate (60-75%), Thermic Effect of Activity (15-30%), Thermic Effect of Food (8-15%), Non-Exercise Activity Thermogenesis (15-20%). These four components determine total daily energy expenditure.
Metabolic adaptation occurs during prolonged caloric restriction, reducing metabolic rate by 10-40% below predicted values. This adaptive thermogenesis explains weight loss plateaus and emphasizes the importance of gradual, sustainable dietary changes rather than extreme caloric restriction.
⭐ Clinical Pearl: Protein turnover consumes approximately 20% of resting metabolic rate. Maintaining adequate protein intake (1.2-1.6 g/kg) during weight loss preserves lean mass and metabolic rate.
These energy systems provide the metabolic foundation for understanding how different dietary patterns, exercise protocols, and clinical interventions influence substrate utilization and overall metabolic health.
⚡ Metabolic Powerhouse: Energy Systems in Action


🎯 Clinical Recognition: Nutritional Assessment Mastery
📌 Remember: ABCD Assessment - Anthropometric (body measurements), Biochemical (lab values), Clinical (physical signs), Dietary (intake patterns). Combine all four for comprehensive nutritional evaluation.
Anthropometric measurements provide objective data about body composition and growth patterns. Body Mass Index (BMI) classifications include: underweight <18.5 kg/m², normal 18.5-24.9 kg/m², overweight 25-29.9 kg/m², and obese ≥30 kg/m². However, BMI limitations include inability to distinguish muscle from fat mass.
- Key Anthropometric Indicators
- Weight-for-Height (BMI)
- Acute malnutrition: <-2 Z-scores
- Severe acute malnutrition: <-3 Z-scores
- Overweight: >+1 Z-score
- Waist Circumference
- Men: increased risk >94cm, high risk >102cm
- Women: increased risk >80cm, high risk >88cm
- Waist-to-Hip Ratio
- Men: increased risk >0.90
- Women: increased risk >0.85
- Android (apple) vs gynoid (pear) fat distribution
- Weight-for-Height (BMI)
⭐ Clinical Pearl: Mid-Upper Arm Circumference (MUAC) provides rapid malnutrition screening in children 6-59 months. MUAC <115mm indicates severe acute malnutrition, while 115-125mm suggests moderate acute malnutrition.
| Assessment Method | Normal Range | Mild Deficiency | Moderate Deficiency | Severe Deficiency | Clinical Significance |
|---|---|---|---|---|---|
| BMI (adults) | 18.5-24.9 kg/m² | - | 17.0-18.4 kg/m² | <17.0 kg/m² | Mortality risk increases |
| MUAC (children) | >125mm | - | 115-125mm | <115mm | Emergency intervention |
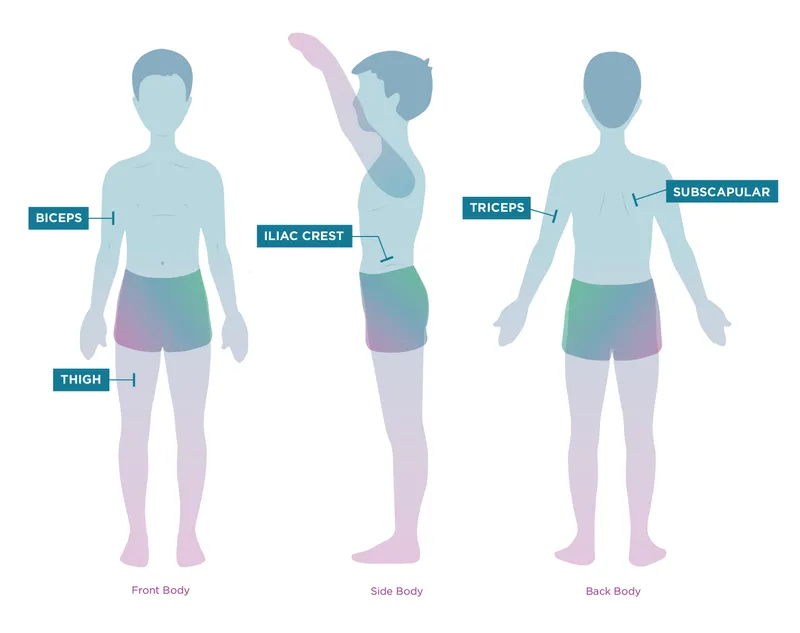
| Triceps Skinfold | 50th percentile | 25th-50th percentile | 10th-25th percentile | <10th percentile | Fat stores assessment |
| Serum Albumin | 35-50 g/L | 30-35 g/L | 25-30 g/L | <25 g/L | Protein status indicator |
| Hemoglobin | 120-160 g/L | 110-119 g/L | 80-109 g/L | <80 g/L | Iron deficiency anemia |
💡 Master This: Functional indicators often precede biochemical changes. Night blindness appears before serum retinol drops, delayed wound healing occurs before albumin decreases, and fatigue manifests before hemoglobin falls significantly.
Clinical examination reveals characteristic signs of specific deficiencies. Bitot's spots indicate vitamin A deficiency, angular cheilitis suggests B-vitamin deficiencies, and koilonychia (spoon nails) indicates iron deficiency. Goiter signals iodine deficiency, while petechial hemorrhages suggest vitamin C deficiency.
📌 Remember: VITAMIN signs - Vision problems (A deficiency), Iron deficiency (pale conjunctiva), Thyroid enlargement (iodine), Angular cheilitis (B vitamins), Muscle wasting (protein), Infections (zinc), Neurological signs (B12/folate).
Dietary assessment methods include 24-hour recall, food frequency questionnaires, food records, and dietary history. Each method has specific advantages and limitations regarding accuracy, practicality, and cost-effectiveness.
⭐ Clinical Pearl: Portion size estimation represents the greatest source of error in dietary assessment. Training individuals to use household measures (cups, spoons) or food models improves accuracy by 25-40%.
These assessment frameworks enable early detection of nutritional imbalances, guiding targeted interventions before clinical complications develop and optimizing therapeutic outcomes across diverse patient populations.
🎯 Clinical Recognition: Nutritional Assessment Mastery


🔬 Diagnostic Precision: Deficiency Pattern Analysis
Protein-Energy Malnutrition (PEM) presents along a spectrum from marasmus (energy deficiency) to kwashiorkor (protein deficiency) to marasmic-kwashiorkor (combined deficiency). Each form demonstrates distinct clinical features, biochemical patterns, and prognostic implications.
📌 Remember: Marasmus = Muscle wasting, Kwashiorkor = Kwelling (swelling). Marasmus shows severe wasting without edema, while kwashiorkor presents with edema, skin changes, and relatively preserved fat stores.
Micronutrient deficiency patterns often overlap, requiring systematic evaluation to identify primary versus secondary deficiencies. Iron deficiency anemia progresses through three stages: iron depletion (↓ferritin), iron deficiency (↓transferrin saturation), and iron deficiency anemia (↓hemoglobin).
- Iron Deficiency Progression
- Stage 1: Iron Depletion
- Ferritin: <15 μg/L (women), <30 μg/L (men)
- Hemoglobin: Normal
- Transferrin saturation: Normal
- Stage 2: Iron Deficiency
- Ferritin: <12 μg/L
- Transferrin saturation: <16%
- Hemoglobin: Normal to slightly low
- Stage 3: Iron Deficiency Anemia
- Hemoglobin: <120 g/L (women), <130 g/L (men)
- MCV: <80 fL (microcytic)
- RDW: >14.5% (increased variation)
- Stage 1: Iron Depletion
⭐ Clinical Pearl: Soluble transferrin receptor (sTfR) remains elevated in iron deficiency even with concurrent inflammation, unlike ferritin which increases with inflammation. sTfR/log ferritin ratio >2.55 indicates iron deficiency.
| Deficiency Type | Primary Biochemical Marker | Secondary Markers | Clinical Signs | Population Risk |
|---|---|---|---|---|
| Iron | Ferritin <15 μg/L | ↓Transferrin saturation | Pale conjunctiva, koilonychia | Women, children |
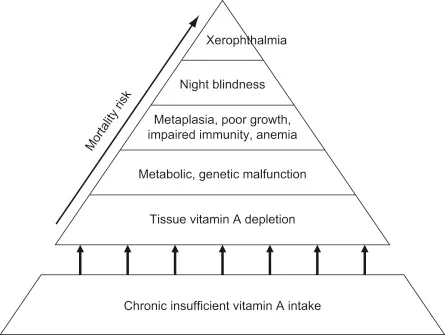
| Vitamin A | Retinol <0.7 μmol/L | ↓RBP, ↑CRP | Night blindness, Bitot's spots | Preschool children |
| Iodine | Urinary iodine <100 μg/L | ↑TSH, ↓T4 | Goiter, cretinism | Inland populations |
| Folate | RBC folate <340 nmol/L | ↑Homocysteine | Megaloblastic anemia | Pregnant women |
| Vitamin B12 | B12 <150 pmol/L | ↑MMA, ↑homocysteine | Neurological symptoms | Elderly, vegans |
💡 Master This: Functional tests often provide earlier deficiency detection than static biochemical markers. Dark adaptation testing detects vitamin A deficiency before serum retinol drops, while taste acuity testing identifies zinc deficiency before serum zinc decreases.
B-vitamin deficiencies frequently coexist due to similar food sources and metabolic interactions. Thiamine deficiency causes beriberi (wet = cardiac, dry = neurological), riboflavin deficiency produces angular cheilitis and glossitis, while niacin deficiency results in pellagra (4 D's: dermatitis, diarrhea, dementia, death).
📌 Remember: Pellagra's 4 D's - Dermatitis (sun-exposed areas), Diarrhea (GI symptoms), Dementia (neurological), Death (if untreated). Niacin deficiency remains common in populations dependent on untreated corn.
Zinc deficiency presents with growth retardation, delayed wound healing, taste abnormalities, and increased infection susceptibility. Serum zinc <10.7 μmol/L suggests deficiency, but levels fluctuate with acute illness and diurnal variation.
⭐ Clinical Pearl: Multiple micronutrient deficiencies are more common than isolated deficiencies in developing countries. Anemia may result from iron, folate, B12, vitamin A, or chronic disease - requiring comprehensive evaluation rather than empirical iron supplementation.
These diagnostic patterns enable precise deficiency identification, guiding targeted therapeutic interventions and preventing progression to irreversible complications through early recognition and appropriate treatment protocols.
🔬 Diagnostic Precision: Deficiency Pattern Analysis


⚕️ Therapeutic Algorithms: Evidence-Based Intervention Strategies
Severe Acute Malnutrition (SAM) management follows standardized WHO protocols with Ready-to-Use Therapeutic Foods (RUTF) providing 175-200 kcal/kg/day and 4-6g protein/kg/day. Treatment success requires weight gain >5g/kg/day and MUAC increase >2mm/week.
📌 Remember: SAM Treatment Phases - Stabilization (F75, treat complications), Rehabilitation (F100, catch-up growth), Follow-up (RUTF, prevent relapse). Each phase has specific caloric and protein targets.
Micronutrient supplementation requires precise dosing to achieve therapeutic benefit without toxicity. Iron supplementation provides 60mg elemental iron daily for 3-6 months to treat deficiency anemia, while prophylactic dosing uses 30mg daily for high-risk populations.
- Evidence-Based Supplementation Protocols
- Iron Deficiency Anemia
- Treatment dose: 60mg elemental iron daily × 3-6 months
- Prophylaxis: 30mg daily (pregnant women)
- Absorption enhancer: Vitamin C 100mg with iron
- Vitamin A Deficiency
- Treatment: 200,000 IU (children >12 months)
- Prophylaxis: 100,000 IU every 6 months
- Pregnant women: 10,000 IU daily (avoid high doses)
- Zinc Deficiency
- Treatment: 20mg elemental zinc daily × 10-14 days
- Diarrhea management: 20mg daily × 10 days
- Prophylaxis: 10mg daily (children)
- Iron Deficiency Anemia
⭐ Clinical Pearl: Iron absorption decreases with concurrent calcium, tea, coffee, or antacids. Heme iron (meat sources) shows 15-35% absorption versus 2-20% for non-heme iron (plant sources). Timing iron supplements between meals optimizes absorption.
| Intervention | Target Population | Dosage | Duration | Monitoring Parameter | Success Criteria |
|---|---|---|---|---|---|
| RUTF (SAM) | Children 6-59 months | 175-200 kcal/kg/day | 6-8 weeks | Weight gain | >5g/kg/day |
| Iron supplementation | IDA patients | 60mg elemental iron | 3-6 months | Hemoglobin | Increase >20g/L |
| Vitamin A | VAD children | 200,000 IU | Single dose | Night blindness | Resolution in 1-2 weeks |
| Zinc (diarrhea) | Children <5 years | 20mg daily | 10 days | Stool frequency | 50% reduction |
| Folic acid | Pregnant women | 400-800 μg daily | Throughout pregnancy | Neural tube defects | 70% reduction risk |
💡 Master This: Refeeding syndrome risk increases with BMI <16 kg/m², weight loss >15% in 3-6 months, or minimal intake >10 days. Start feeding at 25% estimated needs, monitor phosphate, potassium, magnesium, and increase calories gradually.
Food fortification strategies include mass fortification (staple foods), targeted fortification (specific populations), and market-driven fortification (commercial products). Iron fortification of wheat flour uses 30-60mg iron/kg flour, while vitamin A fortification of cooking oil provides 15-30mg retinyl palmitate/kg oil.
📌 Remember: Fortification Vehicle Selection - Universal consumption, Centralized processing, Stable nutrient retention, Affordable cost, Regulatory support. Successful fortification requires all five criteria.
Monitoring protocols track therapeutic response and identify complications early. Hemoglobin increases by 10-20g/L after 2-4 weeks of iron therapy, while ferritin normalization requires 3-6 months. Weight gain velocity in SAM treatment should exceed 5g/kg/day during rehabilitation phase.
⭐ Clinical Pearl: Treatment failure indicators include weight loss, persistent edema after day 10, no appetite return by day 4, or medical complications. These require immediate reassessment and potential inpatient management.
These evidence-based protocols ensure optimal therapeutic outcomes while minimizing adverse effects, providing systematic approaches for addressing nutritional deficiencies across diverse clinical presentations and population groups.
⚕️ Therapeutic Algorithms: Evidence-Based Intervention Strategies


🌐 Systems Integration: Multi-Dimensional Nutritional Networks
Nutrient-nutrient interactions significantly influence bioavailability, metabolism, and physiological function. Iron absorption decreases 50-90% with concurrent calcium intake >300mg, while vitamin C enhances non-heme iron absorption by 3-4 fold. Zinc and copper compete for absorption, requiring balanced supplementation ratios.
📌 Remember: ZINC-COPPER balance - Zinc excess blocks Copper absorption, Copper excess blocks Zinc absorption. Maintain 10:1 zinc:copper ratio in supplementation to prevent competitive inhibition.
Metabolic programming during critical developmental periods establishes long-term health trajectories. Maternal nutrition during the first 1000 days (conception to 24 months) influences offspring's metabolic phenotype, disease susceptibility, and cognitive development through epigenetic mechanisms.
- Critical Nutritional Windows
- Preconception (3 months before conception)
- Folate supplementation: 400-800 μg daily
- Neural tube defect prevention: 70% risk reduction
- Maternal BMI optimization: 18.5-24.9 kg/m²
- First Trimester (0-12 weeks)
- Organogenesis period: highest teratogenic risk
- Folate requirements: 600 μg daily
- Iron needs: 27mg daily (increased blood volume)
- Lactation (0-24 months)
- Energy needs: +500 kcal daily
- Protein requirements: +25g daily
- Exclusive breastfeeding: 0-6 months optimal
- Preconception (3 months before conception)
⭐ Clinical Pearl: Epigenetic modifications from maternal nutrition affect DNA methylation patterns in offspring, influencing gene expression for metabolic enzymes, appetite regulation, and insulin sensitivity throughout life.
| Life Stage | Critical Nutrients | Physiological Impact | Long-term Consequences | Intervention Window |
|---|---|---|---|---|
| Preconception | Folate, Iron, B12 | Oocyte quality | Neural tube defects | 3 months prior |
| First trimester | Folate, Choline | Organogenesis | Cognitive development | 0-12 weeks |
| Second trimester | Iron, Calcium | Fetal growth | Birth weight | 13-26 weeks |
| Third trimester | DHA, Protein | Brain development | Neurodevelopment | 27-40 weeks |
| Lactation | Energy, Protein | Milk production | Infant growth | 0-24 months |
💡 Master This: Microbiome diversity correlates with dietary fiber intake - >30g daily supports beneficial bacteria, while <15g daily promotes pathogenic species. Prebiotic fibers selectively enhance Bifidobacterium and Lactobacillus populations.
Chrononutrition recognizes that nutrient timing affects metabolic responses through circadian rhythm modulation. Insulin sensitivity peaks in the morning and declines throughout the day, suggesting carbohydrate timing optimization for metabolic health.
📌 Remember: Circadian Eating - Breakfast like a king (high carbs), Lunch like a prince (balanced), Dinner like a pauper (low carbs). Aligning nutrient intake with circadian rhythms optimizes metabolic efficiency.
Nutrient-gene interactions through nutrigenomics reveal how genetic variations affect nutrient metabolism, dietary requirements, and disease susceptibility. MTHFR polymorphisms affect folate metabolism, requiring higher folate intake or methylfolate supplementation in affected individuals.
⭐ Clinical Pearl: Personalized nutrition based on genetic testing shows 2-3 fold better adherence and improved metabolic outcomes compared to standard dietary recommendations, particularly for weight management and cardiovascular risk reduction.
Stress-nutrition interactions demonstrate how psychological stress alters nutrient requirements, appetite regulation, and metabolic efficiency. Chronic stress increases cortisol production, promoting abdominal fat accumulation and insulin resistance while depleting B-vitamins, magnesium, and vitamin C.
These integrated systems reveal nutrition's complexity beyond individual nutrients, emphasizing the importance of holistic approaches that consider temporal, genetic, microbial, and environmental factors in optimizing nutritional interventions for diverse populations and clinical conditions.
🌐 Systems Integration: Multi-Dimensional Nutritional Networks

🎯 Clinical Mastery Arsenal: Rapid Assessment and Intervention Tools
Rapid Nutritional Screening employs validated tools for immediate risk stratification. MUST (Malnutrition Universal Screening Tool) scores BMI, weight loss, and acute disease effect to categorize low (score 0), medium (score 1), or high risk (score ≥2) for malnutrition.
📌 Remember: MUST Scoring - Mass (BMI points), Unplanned weight loss (percentage), Sick effect (acute disease), Total score determines intervention. Score ≥2 requires immediate nutritional intervention.
Emergency Nutritional Interventions follow standardized protocols based on clinical presentation severity. Severe malnutrition requires immediate stabilization with F75 formula at 100ml/kg/day, while moderate malnutrition uses RUTF at 175 kcal/kg/day.
- Clinical Decision Framework
- Immediate Priority (0-24 hours)
- Hypoglycemia: glucose <2.5 mmol/L → 10% glucose IV
- Dehydration: ReSoMal solution for SAM children
- Hypothermia: temperature <35°C → warming + feeding
- Short-term Priority (1-7 days)
- Appetite stimulation: F75 → F100 transition
- Infection treatment: antibiotics per protocol
- Micronutrient replacement: vitamin A, zinc, iron
- Long-term Priority (1-12 weeks)
- Catch-up growth: weight gain >5g/kg/day
- Behavioral counseling: feeding practices
- Follow-up monitoring: weekly → monthly visits
- Immediate Priority (0-24 hours)
⭐ Clinical Pearl: Refeeding syndrome prevention requires phosphate monitoring - start feeding at 25% estimated needs if BMI <16, weight loss >15%, or minimal intake >10 days. Monitor phosphate, potassium, magnesium daily.
| Clinical Scenario | Assessment Tool | Intervention | Target Outcome | Monitoring Frequency |
|---|---|---|---|---|
| Hospital admission | MUST score | Nutritional support plan | Score improvement | Weekly |
| SAM in children | MUAC + edema | RUTF therapy | Weight gain >5g/kg/day | Weekly |
| Iron deficiency | Hemoglobin + ferritin | Iron supplementation | Hb increase >20g/L | Monthly |
| Vitamin A deficiency | Night blindness | 200,000 IU dose | Symptom resolution | 1-2 weeks |
| Refeeding risk | BMI + intake history | Gradual calorie increase | Stable electrolytes | Daily |
💡 Master This: Functional deficiency signs appear before biochemical changes - night blindness precedes low serum retinol, fatigue occurs before anemia, delayed healing happens before low albumin. Clinical vigilance enables early intervention.
Therapeutic Monitoring Protocols track intervention effectiveness and identify complications. Weight gain velocity in SAM should exceed 5g/kg/day, hemoglobin should increase 10-20g/L after 2-4 weeks of iron therapy, and MUAC should increase ≥2mm/week during treatment.
📌 Remember: Treatment Failure Indicators - Weight loss continues, Edema persists >10 days, Appetite absent >4 days, Kcomplications develop. Any WEAK sign requires immediate reassessment and management modification.
Population-Specific Interventions address unique nutritional vulnerabilities across different groups. Pregnant women require folate 600μg, iron 27mg, and calcium 1000mg daily. Elderly patients need protein 1.2g/kg, vitamin D 800-1000 IU, and B12 monitoring due to absorption issues.
⭐ Clinical Pearl: High-yield interventions with maximum population impact include iron-folate supplementation (pregnant women), vitamin A supplementation (children 6-59 months), zinc supplementation (diarrhea treatment), and exclusive breastfeeding promotion (0-6 months).
Quality Indicators measure program effectiveness and guide resource allocation. Coverage rates >80% for supplementation programs, default rates <15% for SAM treatment, and exclusive breastfeeding rates >50% represent achievable targets with systematic implementation.
These clinical tools enable rapid, evidence-based nutritional care that improves patient outcomes while optimizing resource utilization across diverse healthcare settings and population groups.
🎯 Clinical Mastery Arsenal: Rapid Assessment and Intervention Tools

Unlock the full lesson and continue reading
Signup to continue reading this lesson and unlimited access questions, flashcards, AI notes, and more


Have doubts about this lesson?
Ask Rezzy, your AI Study Partner, to explain anything you didn't understand
Everything you need for NEET-PG prep
Get full Oncourse access with lessons, practice questions, flashcards and AI study tools.
Scan to download app