
Detoxification Pathways

On this page
🔬 The Cellular Cleanup Command Center
Every cell in your body faces a relentless chemical challenge: transforming potentially harmful compounds into safe, excretable molecules without destroying itself in the process. You'll discover how Phase I and II detoxification enzymes work as coordinated systems, learn to recognize when these pathways falter through metabolic phenotyping, and master the clinical algorithms that turn biochemical insight into precise therapeutic intervention. This journey connects molecular mechanisms to bedside decision-making, equipping you to assess, diagnose, and treat metabolic dysfunction with confidence.
📌 Remember: PHASE - Phase I Hydroxylates, Adds polar groups; Synthesis reactions in Phase II; Elimination enhanced through conjugation
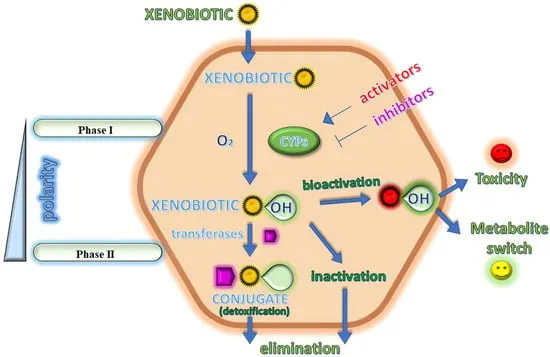
Detoxification Architecture: The Two-Phase System
-
Phase I Reactions (Functionalization)
- Cytochrome P450 enzymes: 57 different isoforms in humans
- Primary reactions: Oxidation (85%), reduction (10%), hydrolysis (5%)
- Hydroxylation: Adds -OH groups for polarity
- Dealkylation: Removes alkyl groups from substrates
- Epoxidation: Creates reactive intermediates requiring Phase II
- Location: Primarily hepatic endoplasmic reticulum (70%), extrahepatic tissues (30%)
- Metabolic capacity: 1-2 grams of xenobiotics processed daily
-
Phase II Reactions (Conjugation)
- Six major conjugation pathways with distinct substrate preferences
- Glucuronidation: Handles 60% of Phase II metabolism
- UGT enzymes: 19 functional isoforms in humans
- Substrate capacity: 500-1000 mg/day for most compounds
- Sulfation: Processes 15% of conjugation reactions
- SULT enzymes: 13 cytosolic isoforms identified
- High-affinity, low-capacity system: 50-100 mg/day maximum
- Glutathione conjugation: 10% of reactions, critical for electrophiles
⭐ Clinical Pearl: Phase I reactions often increase toxicity by creating reactive intermediates, while Phase II reactions always decrease toxicity through conjugation. This explains why Phase II enzyme induction is protective, while isolated Phase I induction can be dangerous.
| Pathway | Primary Enzymes | Substrate Examples | Daily Capacity | Clinical Significance |
|---|---|---|---|---|
| Glucuronidation | UGT1A1, UGT2B7 | Bilirubin, morphine, acetaminophen | 500-1000 mg | Gilbert's syndrome, drug clearance |
| Sulfation | SULT1A1, SULT2A1 | Acetaminophen, estrogens | 50-100 mg | Saturable at therapeutic doses |
| Glutathione | GST-α, GST-μ, GST-π | Acetaminophen metabolites, alkylating agents | Variable | Hepatotoxicity protection |
| Acetylation | NAT1, NAT2 | Isoniazid, hydralazine, procainamide | 100-200 mg | Genetic polymorphisms affect toxicity |
| Methylation | COMT, TPMT | Catecholamines, 6-mercaptopurine | 10-50 mg | Neurotransmitter metabolism |
💡 Master This: The Phase I:Phase II ratio determines toxicity risk. Healthy individuals maintain a 1:3 ratio (one Phase I reaction for every three Phase II reactions). When this ratio increases above 1:2, reactive intermediate accumulation leads to oxidative stress and cellular damage.
Understanding detoxification capacity predicts individual responses to medications, environmental exposures, and metabolic stress. Connect these foundational pathways through enzymatic regulation mechanisms to master clinical pharmacokinetics.
🔬 The Cellular Cleanup Command Center


⚙️ The Enzymatic Orchestra: Regulation and Coordination
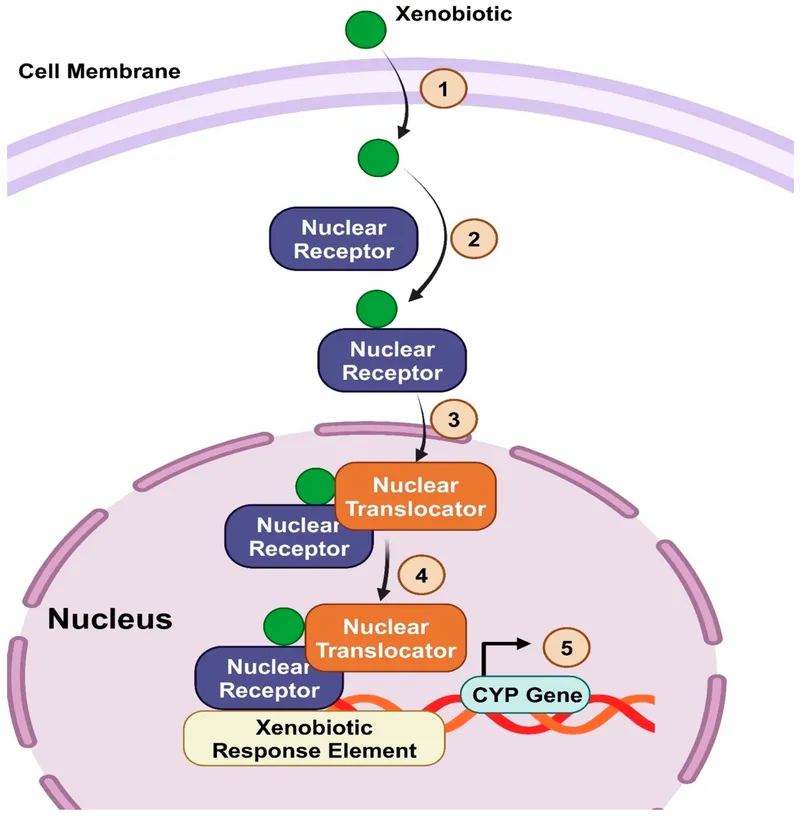
📌 Remember: ARNT - Aryl hydrocarbon Receptor Nuclear Translocator; CAR - Constitutive Androstane Receptor; PXR - Pregnane X Receptor control Phase I induction
Nuclear Receptor Command System
-
Pregnane X Receptor (PXR) - The Master Inducer
- Controls CYP3A4 expression (50% of hepatic P450 content)
- Activation threshold: 1-10 μM for most ligands
- Induction magnitude: 5-20 fold increase in enzyme activity
- Rifampin: 15-fold CYP3A4 induction within 3 days
- St. John's Wort: 3-5 fold induction, persists 2 weeks after discontinuation
- Phenytoin: 8-12 fold induction with chronic dosing
- Cross-regulation: Induces UGT1A1 and MDR1 simultaneously
-
Constitutive Androstane Receptor (CAR) - The Phenobarbital Pathway
- Primary target: CYP2B6 and CYP2C9 induction
- Unique mechanism: Constitutively active, requires inverse agonists for suppression
- Phenobarbital: 10-fold CYP2B6 induction via CAR activation
- CITCO (research compound): 20-fold maximum induction capacity
- Clinical relevance: 30% of drug-drug interactions involve CAR-mediated induction
- Aryl Hydrocarbon Receptor (AhR) - The Environmental Sensor
- Responds to: Polycyclic aromatic hydrocarbons, dioxins, indoles
- Target genes: CYP1A1, CYP1A2, CYP1B1
- 3-Methylcholanthrene: 50-fold CYP1A1 induction
- Cigarette smoke: 3-5 fold CYP1A2 induction in smokers
- Cruciferous vegetables: 2-3 fold protective induction
- Tissue distribution: High expression in lung, liver, intestine
⭐ Clinical Pearl: Enzyme induction requires 3-7 days to reach maximum effect and 7-14 days to return to baseline after inducer withdrawal. This timing explains why drug interactions may not be immediately apparent and why dose adjustments must be gradual.
| Nuclear Receptor | Primary Targets | Induction Magnitude | Time to Peak | Clinical Examples |
|---|---|---|---|---|
| PXR | CYP3A4, UGT1A1, MDR1 | 5-20 fold | 3-5 days | Rifampin, carbamazepine, dexamethasone |
| CAR | CYP2B6, CYP2C9, CYP3A4 | 5-15 fold | 2-4 days | Phenobarbital, phenytoin, rifampin |
| AhR | CYP1A1, CYP1A2, CYP1B1 | 10-50 fold | 6-12 hours | Smoking, charcoal-broiled foods, omeprazole |
| Nrf2 | GSTs, UGTs, NQO1 | 2-10 fold | 4-8 hours | Sulforaphane, curcumin, oxidative stress |
| PPARα | CYP4A, fatty acid oxidation | 3-8 fold | 12-24 hours | Fibrates, fatty acids, peroxisome proliferators |
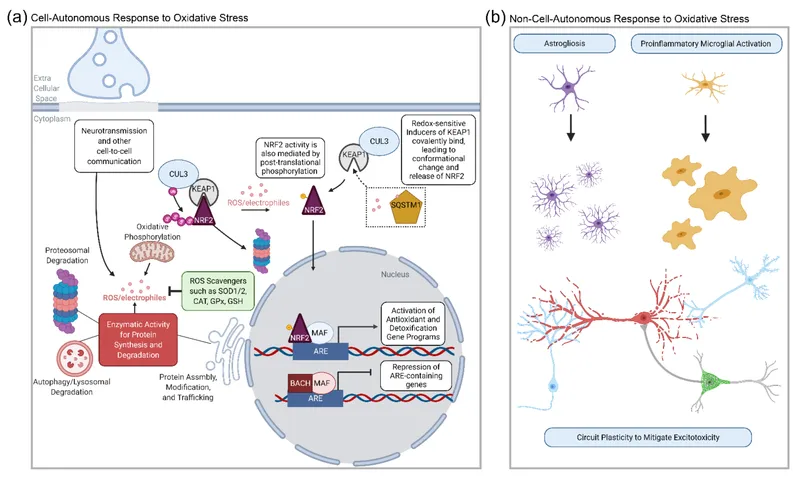
- Nuclear Factor Erythroid 2-Related Factor 2 (Nrf2)
- Master regulator of 200+ cytoprotective genes
- Baseline state: Keap1 binding maintains 27-minute Nrf2 half-life
- Activation triggers: Electrophiles, oxidative stress, Phase I metabolites
- Sulforaphane: 5-fold GST induction within 4 hours
- Acetaminophen metabolites: 3-fold protective response
- Curcumin: 2-4 fold broad antioxidant enzyme induction
💡 Master This: Coordinated induction is protective - simultaneous Phase I and Phase II enzyme induction maintains the critical 1:3 metabolic ratio. Isolated Phase I induction without Phase II coordination increases toxicity risk by 300-500% due to reactive intermediate accumulation.
Understanding enzymatic coordination reveals why combination therapies require careful timing and why genetic polymorphisms in nuclear receptors create personalized medicine requirements. Connect these regulatory mechanisms through genetic variation patterns to predict individual metabolic capacity.
⚙️ The Enzymatic Orchestra: Regulation and Coordination


🎯 Pattern Recognition: Metabolic Phenotyping in Clinical Practice
📌 Remember: SLOW - Slow acetylators, Low CYP2D6 activity, Oxidative stress markers, Warfarin sensitivity indicate reduced metabolic capacity
CYP2D6 Phenotyping: The Psychiatric Drug Gateway
-
Ultra-Rapid Metabolizers (UMs) - 1-2% Population
- Genotype: Gene duplications (>2 functional copies)
- Clinical pattern: Therapeutic failure at standard doses
- Codeine: No analgesic effect due to rapid morphine formation
- Tricyclic antidepressants: Require 2-3x normal doses
- Tamoxifen: Enhanced efficacy due to rapid endoxifen formation
- Recognition markers: Low drug:metabolite ratios in plasma
-
Extensive Metabolizers (EMs) - 77-92% Population
- Genotype: Two functional alleles (*1/*1, *1/*2)
- Standard dosing protocols designed for this population
- Dextromethorphan:dextrorphan ratio: 0.1-0.3 (normal range)
-
Intermediate Metabolizers (IMs) - 2-11% Population
- Genotype: One functional allele (*1/*4, *1/*5)
- Clinical pattern: Mild dose reduction requirements (25-50%)
- Drug accumulation risk with standard dosing protocols
-
Poor Metabolizers (PMs) - 5-10% Caucasians, 1% Asians
- Genotype: No functional alleles (*4/*4, *5/*5)
- Clinical pattern: Severe toxicity at standard doses
- Metoprolol: 5-fold higher plasma levels, bradycardia risk
- Fluoxetine: 10-fold longer half-life, serotonin syndrome risk
- Dextromethorphan:dextrorphan ratio: >20 (diagnostic threshold)
⭐ Clinical Pearl: CYP2D6 poor metabolizers have 10-fold higher risk of adverse drug reactions with psychiatric medications. Always check for "drug sensitivity history" - patients often report previous medication intolerances that suggest PM phenotype.
| Phenotype | Population Frequency | Enzyme Activity | Clinical Recognition Pattern | Dosing Adjustment |
|---|---|---|---|---|
| Ultra-Rapid | 1-2% | >200% normal | Therapeutic failure, low drug levels | Increase 150-300% |
| Extensive | 77-92% | 100% normal | Standard drug response | Standard dosing |
| Intermediate | 2-11% | 25-50% normal | Mild side effects, prolonged response | Reduce 25-50% |
| Poor | 5-10% | <5% normal | Severe toxicity, drug accumulation | Reduce 50-90% |
-
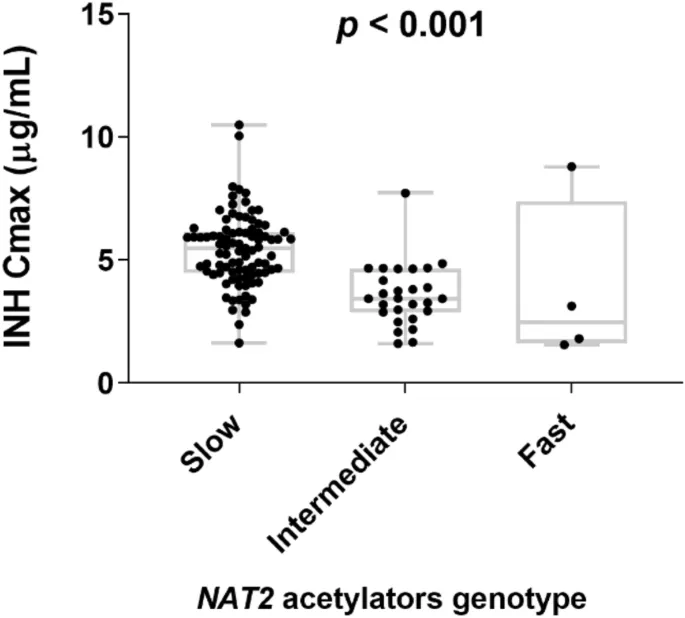
Rapid Acetylators (50-60% Population)
- NAT2 genotype: Two functional alleles
- Isoniazid half-life: 1-2 hours (normal)
- Clinical patterns:
- Therapeutic failure with standard isoniazid dosing
- Reduced risk of isoniazid hepatotoxicity (<1%)
- Higher risk of treatment failure in tuberculosis (15-20%)
-
Slow Acetylators (40-50% Population)
- NAT2 genotype: Reduced function alleles
- Isoniazid half-life: 4-6 hours (prolonged)
- Clinical patterns:
- Increased hepatotoxicity risk (5-10% incidence)
- Enhanced therapeutic efficacy at standard doses
- Lupus-like syndrome with hydralazine, procainamide
Warfarin Sensitivity: Multi-Gene Integration
-
CYP2C9 Variants
- CYP2C9*2 and CYP2C9*3: 30-80% reduced activity
- Clinical impact: 2-5 fold increased bleeding risk
- Dose requirements: 20-60% reduction from standard protocols
-
VKORC1 Haplotypes
- High sensitivity haplotype (A): 50% dose reduction required
- Low sensitivity haplotype (B): Standard or increased dosing
- Population distribution: 37% A/A, 45% A/B, 18% B/B
💡 Master This: Phenotype prediction accuracy reaches 85-95% when combining genetic testing with clinical observation patterns. Look for drug sensitivity clusters - patients with one enzyme deficiency often have multiple metabolic variants requiring comprehensive assessment.
Understanding metabolic phenotypes enables precision dosing and toxicity prevention. Connect these recognition patterns through drug interaction mechanisms to master complex polypharmacy management.
🎯 Pattern Recognition: Metabolic Phenotyping in Clinical Practice


🔍 Differential Diagnosis: Metabolic Dysfunction Patterns
📌 Remember: HEPATIC - Hereditary enzyme defects, Ethanol-induced changes, Pharmacologic inhibition, Age-related decline, Toxin exposure, Inflammatory states, Cirrhosis effects
Genetic Enzyme Deficiencies: Constitutional Patterns
-
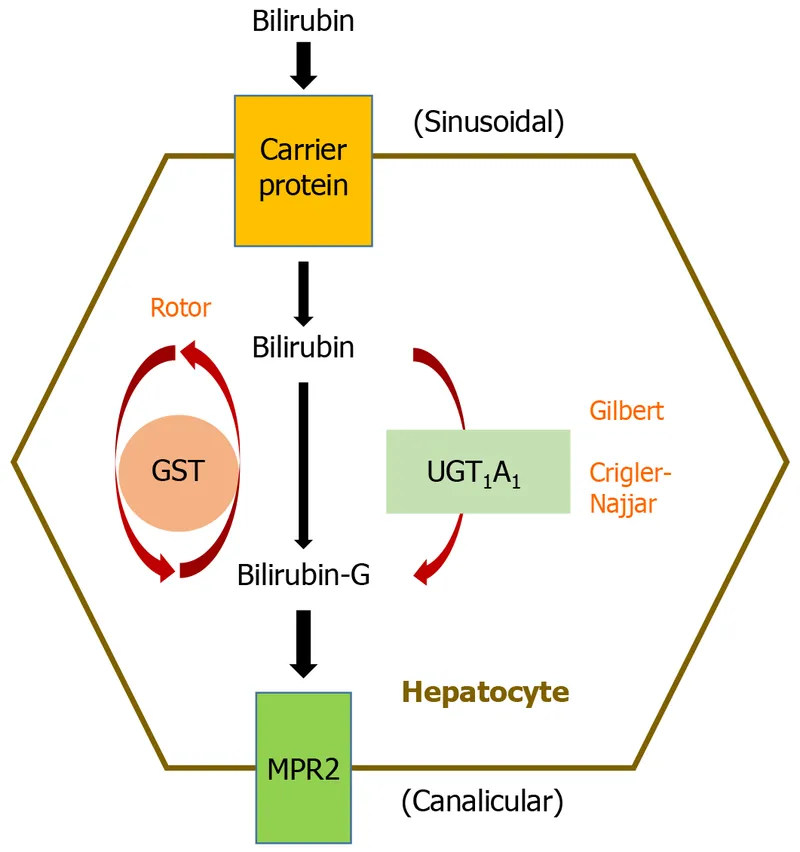
Gilbert's Syndrome (UGT1A1 Deficiency)
- Prevalence: 5-10% of population (most common)
- Biochemical signature: Unconjugated hyperbilirubinemia (2-6 mg/dL)
- Clinical patterns:
- Intermittent jaundice during stress, fasting, illness
- Normal liver enzymes (ALT, AST, alkaline phosphatase)
- Irinotecan toxicity risk (severe diarrhea, neutropenia)
- Diagnostic test: Genetic testing for UGT1A1*28 promoter variant
- Drug implications: 50% irinotecan dose reduction required
-
Crigler-Najjar Syndrome (Severe UGT1A1 Deficiency)
- Type I: Complete enzyme absence, bilirubin >20 mg/dL
- Type II: Partial deficiency, bilirubin 6-20 mg/dL
- Clinical emergency: Kernicterus risk in neonates
- Treatment: Phototherapy, liver transplantation for Type I
- Glucose-6-Phosphate Dehydrogenase (G6PD) Deficiency
- Prevalence: 400 million people worldwide
- Metabolic impact: Reduced glutathione regeneration capacity
- Clinical triggers: Oxidative stress from drugs, foods, infections
- Primaquine: Severe hemolysis within 24-48 hours
- Sulfonamides: Dose-dependent hemolytic risk
- Fava beans: Favism in Mediterranean variants
- Laboratory findings: Heinz bodies, decreased haptoglobin
⭐ Clinical Pearl: G6PD deficiency creates a "metabolic fragility" pattern - patients tolerate normal conditions but develop severe toxicity with oxidative stress. Always screen before prescribing antimalarials, sulfonamides, or nitrofurantoin in high-risk populations.
| Genetic Deficiency | Enzyme Affected | Clinical Presentation | Diagnostic Markers | Drug Implications |
|---|---|---|---|---|
| Gilbert's Syndrome | UGT1A1 | Intermittent jaundice | Unconjugated bilirubin 2-6 mg/dL | Irinotecan dose reduction |
| Crigler-Najjar | UGT1A1 (severe) | Persistent jaundice | Unconjugated bilirubin >6 mg/dL | Avoid glucuronidated drugs |
| G6PD Deficiency | G6PD | Hemolysis with oxidants | Heinz bodies, low G6PD activity | Avoid oxidizing agents |
| Dubin-Johnson | MRP2 transporter | Conjugated hyperbilirubinemia | Black liver on biopsy | Impaired drug excretion |
| Rotor Syndrome | OATP1B1/1B3 | Conjugated hyperbilirubinemia | Normal liver histology | Reduced drug uptake |
-
Chronic Liver Disease Progression
- Child-Pugh Class A: Minimal metabolic impairment (<25% reduction)
- Preserved Phase I metabolism for most drugs
- Albumin >3.5 g/dL, bilirubin <2 mg/dL
- Child-Pugh Class B: Moderate impairment (25-50% reduction)
- Dose reduction required for hepatically cleared drugs
- Albumin 2.8-3.5 g/dL, bilirubin 2-3 mg/dL
- Child-Pugh Class C: Severe impairment (>75% reduction)
- Avoid hepatotoxic drugs, consider alternative routes
- Albumin <2.8 g/dL, bilirubin >3 mg/dL
- Child-Pugh Class A: Minimal metabolic impairment (<25% reduction)
-
Alcohol-Induced Metabolic Changes
- Acute alcohol: CYP2E1 inhibition, competitive metabolism
- Chronic alcohol: CYP2E1 induction (5-10 fold increase)
- Enhanced acetaminophen toxicity (lower threshold: 4-6 g vs 10-15 g)
- Increased warfarin metabolism (higher dose requirements)
- Tolerance to sedatives, anesthetics
Drug-Induced Metabolic Inhibition: Interaction Patterns
-
Strong CYP3A4 Inhibitors (>5-fold AUC increase)
- Ketoconazole: >10-fold inhibition, irreversible binding
- Ritonavir: Mechanism-based inhibition, 24-48 hour recovery
- Grapefruit juice: Intestinal CYP3A4 inhibition, 72-hour effect
- Clinical pattern: Rapid onset toxicity (24-48 hours)
-
CYP2D6 Inhibition Spectrum
- Quinidine: >95% inhibition, "phenocopy" of PM status
- Fluoxetine: Active metabolite (norfluoxetine) extends inhibition weeks
- Paroxetine: Irreversible inhibition, 7-14 day recovery
💡 Master This: Inhibition onset is immediate (within hours), while induction requires days to weeks. Recovery from inhibition follows drug elimination kinetics, while recovery from induction requires new enzyme synthesis (5-7 half-lives of the inducer).
Understanding metabolic dysfunction patterns enables rapid diagnosis and appropriate therapeutic adjustments. Connect these differential frameworks through treatment algorithm development to optimize patient outcomes.
🔍 Differential Diagnosis: Metabolic Dysfunction Patterns


⚖️ Treatment Algorithms: Precision Metabolic Medicine
📌 Remember: DOSE - Determine phenotype, Optimize based on genetics, Start low and titrate, Evaluate response and adjust
Warfarin Dosing Algorithm: Multi-Gene Integration
-
Initial Dose Calculation (FDA-Approved Algorithm)
- Base dose: 5-10 mg daily for average adult
- Age adjustment: -0.2767 × (age - 60) if age >60
- CYP2C9 adjustment:
- **2/2 or **2/3: Reduce 25-50%
- **3/3: Reduce 50-75%
- VKORC1 adjustment:
- AA genotype: Reduce 25-50%
- AB genotype: Standard dosing
- BB genotype: Increase 10-25%
-
Clinical Implementation Protocol
- Week 1: Start calculated dose, check INR on day 3
- Week 2: Adjust based on INR response (±10-20% dose changes)
- Steady state: Achieved by day 5-7, final adjustments
- Target INR: 2.0-3.0 for most indications, 2.5-3.5 for mechanical valves
⭐ Clinical Pearl: Pharmacogenetic-guided warfarin dosing reduces time to therapeutic INR by 30-40% and decreases bleeding complications by 25-35% compared to standard dosing protocols. Greatest benefit in patients requiring <3 mg/day or >7 mg/day.
| Genotype Combination | Predicted Dose Range | Time to Therapeutic INR | Bleeding Risk | Monitoring Intensity |
|---|---|---|---|---|
| **CYP2C91/1 + VKORC1 BB | 7-12 mg/day | 5-7 days | Standard | Weekly × 4 weeks |
| **CYP2C91/1 + VKORC1 AB | 4-8 mg/day | 5-7 days | Standard | Weekly × 4 weeks |
| **CYP2C91/1 + VKORC1 AA | 2-5 mg/day | 7-10 days | Increased | Every 3 days × 2 weeks |
| **CYP2C92/3 + VKORC1 AA | 1-3 mg/day | 10-14 days | High | Every 2 days × 2 weeks |
| **CYP2C93/3 + VKORC1 AA | 0.5-2 mg/day | 14-21 days | Very High | Daily × 1 week |
-
Antidepressant Selection Algorithm
- Ultra-Rapid Metabolizers:
- Avoid: Tricyclics, fluoxetine (therapeutic failure likely)
- Prefer: Sertraline, citalopram (non-CYP2D6 substrates)
- Dosing: 150-200% of standard doses if CYP2D6 substrate required
- Poor Metabolizers:
- Avoid: Tricyclics, paroxetine (high toxicity risk)
- Prefer: Sertraline, escitalopram (minimal CYP2D6 involvement)
- Dosing: 25-50% of standard doses for CYP2D6 substrates
- Ultra-Rapid Metabolizers:
-
Antipsychotic Dosing Adjustments
- Haloperidol (CYP2D6 substrate):
- Poor metabolizers: Start 0.5-1 mg daily (vs 2-5 mg standard)
- Ultra-rapid metabolizers: May require 10-15 mg daily
- Risperidone (CYP2D6 dependent):
- Poor metabolizers: 50% dose reduction, monitor for EPS
- Extensive metabolizers: Standard 1-2 mg twice daily
- Haloperidol (CYP2D6 substrate):
Oncology Precision Dosing: Irinotecan UGT1A1 Protocol
-
UGT1A1 Genotype-Based Dosing
- Wild-type (*1/*1): Standard dose 180 mg/m² every 2 weeks
- Heterozygous (*1/*28): Reduce to 150 mg/m², monitor closely
- Homozygous (*28/*28): Reduce to 120 mg/m² or avoid irinotecan
- Monitoring: Weekly CBC, diarrhea assessment, performance status
-
Toxicity Management Protocol
- Grade 3-4 diarrhea: Hold therapy, aggressive supportive care
- Neutropenia <1000: Dose reduction 25%, G-CSF support
- Bilirubin >1.5× ULN: Contraindication regardless of genotype
💡 Master This: Preemptive dose reduction based on genetic testing prevents severe toxicity in 85-90% of high-risk patients while maintaining therapeutic efficacy. The "start low, go slow" approach is safer than "standard dose and rescue" for genetically susceptible patients.
Understanding precision dosing algorithms enables safe, effective personalized therapy. Connect these treatment protocols through advanced integration concepts to master complex clinical scenarios.
⚖️ Treatment Algorithms: Precision Metabolic Medicine


🔗 Systems Integration: The Metabolic Network
📌 Remember: NETWORK - Nuclear receptor crosstalk, Efflux transporter coordination, Tissue-specific expression, Whole-body clearance, Organ-organ communication, Redox balance, Kinetic interactions
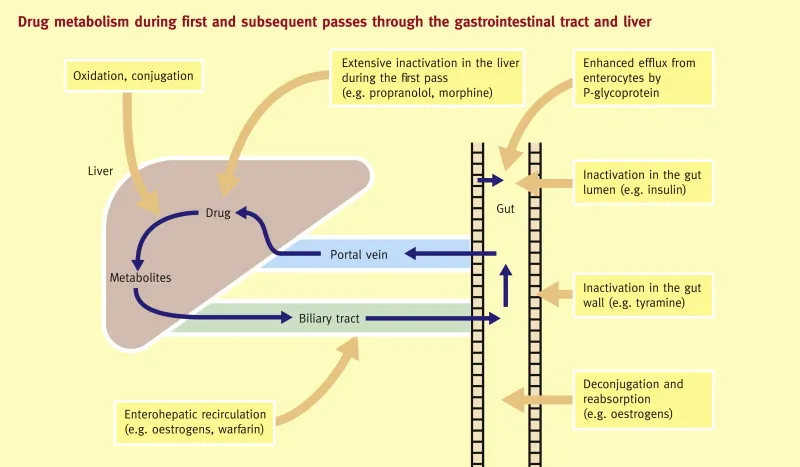
Hepatic-Intestinal Metabolic Axis
-
First-Pass Metabolism Coordination
- Intestinal CYP3A4: 70% of total body content (higher than liver)
- P-glycoprotein co-localization: Synergistic substrate efflux
- Bioavailability equation: F = fa × Fg × Fh
- fa: Fraction absorbed (transporter-dependent)
- Fg: Fraction escaping gut metabolism (CYP3A4-dependent)
- Fh: Fraction escaping hepatic metabolism (liver CYP3A4-dependent)
- Clinical example: Cyclosporine bioavailability 10-60% (highly variable)
-
Enterohepatic Circulation Integration
- Phase II conjugates undergo bacterial deconjugation in colon
- Reabsorption extends drug half-life by 2-5 fold
- Clinical significance: Estrogen recycling, morphine prolongation
- Antibiotics disrupt circulation, reduce efficacy (25-50%)
- Cholestyramine interrupts circulation, enhances elimination
- Microbiome-Metabolism Interface
- Bacterial enzymes metabolize >40 commonly used drugs
- β-glucuronidases reactivate glucuronide conjugates
- Reduction reactions: Digoxin to dihydrodigoxin (inactive)
- Eggerthella lenta bacteria responsible
- Antibiotic treatment restores digoxin activity
- Individual variation: 10-100 fold differences in bacterial enzyme activity
⭐ Clinical Pearl: Grapefruit juice inhibits intestinal CYP3A4 but not hepatic CYP3A4, creating selective first-pass inhibition. This explains why the interaction affects oral but not IV drug administration and why effects persist 72 hours after consumption.
| Integration Point | Mechanism | Clinical Impact | Quantitative Effect | Management Strategy |
|---|---|---|---|---|
| Gut-Liver Axis | CYP3A4 + P-gp coordination | Variable bioavailability | 10-60% range | Monitor levels, adjust doses |
| Enterohepatic | Bacterial deconjugation | Extended half-life | 2-5 fold increase | Consider circulation disruptors |
| Microbiome | Bacterial metabolism | Drug activation/inactivation | 10-100 fold variation | Assess antibiotic history |
| Transporter-Enzyme | Coordinated induction | Synergistic clearance | 5-20 fold changes | Expect delayed interactions |
-
Total Body Clearance Calculation
- CLtotal = CLrenal + CLhepatic + CLother
- Renal clearance: Filtration + secretion - reabsorption
- GFR component: Unbound drug × 120 mL/min
- Secretion component: Transporter-mediated (OAT, OCT, P-gp)
- Hepatic clearance: Qh × fu × CLint / (Qh + fu × CLint)
- Qh: Hepatic blood flow (1500 mL/min)
- fu: Unbound fraction
- CLint: Intrinsic clearance
-
Organ Crosstalk in Disease States
- Hepatorenal syndrome: Kidney dysfunction secondary to liver failure
- Creatinine clearance decreases 50-80%
- Drug accumulation for renally cleared medications
- Cardiorenal syndrome: Heart failure reduces hepatic blood flow
- Hepatic clearance decreases 30-60%
- Flow-limited drugs most affected (lidocaine, propranolol)
- Hepatorenal syndrome: Kidney dysfunction secondary to liver failure
Nuclear Receptor Network Effects
-
Cross-Regulatory Pathways
- PXR activation induces CYP3A4, UGT1A1, MDR1 simultaneously
- CAR activation induces CYP2B6, CYP3A4, UGT1A1, MRP2
- Nrf2 activation induces GSTs, UGTs, NQO1, HO-1
- Network amplification: Single inducer affects multiple pathways
-
Temporal Coordination
- Phase I induction: Peak at 24-48 hours
- Phase II induction: Peak at 4-12 hours (faster response)
- Transporter induction: Peak at 12-24 hours
- Protective sequence: Antioxidants → Conjugation → Efflux → Oxidation
💡 Master This: Network resilience explains why single enzyme inhibition rarely causes severe toxicity, while multiple pathway disruption (genetic + disease + drug interactions) creates exponential risk increases. Always assess cumulative metabolic burden rather than individual pathway effects.
Understanding metabolic network integration enables prediction of complex clinical scenarios and optimization of multi-drug regimens. Connect these systems concepts through rapid mastery frameworks to achieve clinical expertise.
🔗 Systems Integration: The Metabolic Network


🎯 Clinical Mastery Arsenal: Rapid Assessment Tools
📌 Remember: RAPID - Recognize phenotype, Assess interactions, Predict outcomes, Implement adjustments, Document response
Essential Clinical Assessment Matrix
| Clinical Scenario | Key Recognition Pattern | Immediate Action | Monitoring Priority | Success Metric |
|---|---|---|---|---|
| New psychiatric medication | Previous drug sensitivities | CYP2D6 testing if available | Weekly symptom assessment | Therapeutic response in 2-4 weeks |
| Warfarin initiation | Age >65, multiple medications | Genetic testing + low starting dose | INR every 2-3 days | Therapeutic INR in 5-10 days |
| Unexplained drug toxicity | Standard dose, severe reaction | Phenotype assessment + dose reduction | Toxicity resolution | Symptom improvement in 24-48 hours |
| Cancer chemotherapy | UGT1A1 substrate (irinotecan) | Genetic testing before treatment | Weekly CBC + diarrhea assessment | Tolerable toxicity profile |
| Chronic liver disease | Child-Pugh B or C | Hepatic dose adjustments | Drug levels + clinical response | Therapeutic effect without toxicity |
-
Ultra-Rapid Metabolizer Clues
- Therapeutic failure at standard doses
- Family history of medication resistance
- Rapid drug tolerance development
- Low drug:metabolite ratios in plasma
- Action: Increase dose 150-300% or choose alternative pathway
-
Poor Metabolizer Red Flags
- Severe side effects at low doses
- Prolonged drug effects beyond expected duration
- Multiple drug sensitivities in personal history
- High drug:metabolite ratios in plasma
- Action: Reduce dose 50-90% or avoid substrate entirely
High-Yield Drug Interaction Predictions
-
CYP3A4 Substrate + Strong Inhibitor
- Prediction: 5-20 fold AUC increase within 24-48 hours
- Examples: Simvastatin + ketoconazole, cyclosporine + grapefruit
- Management: Reduce substrate dose 80-90% or hold temporarily
-
CYP2D6 Substrate + Quinidine
- Prediction: >95% enzyme inhibition, "phenocopy" poor metabolizer
- Duration: 24-48 hours after quinidine discontinuation
- Management: Treat as poor metabolizer during co-administration
-
Warfarin + Broad-Spectrum Antibiotic
- Prediction: INR increase due to vitamin K depletion + enterohepatic disruption
- Timeline: 3-7 days after antibiotic initiation
- Management: Increase INR monitoring to every 2-3 days
⭐ Clinical Pearl: The "Rule of 5s" for drug interactions - 5-fold AUC changes require dose adjustments, interactions peak at 5 half-lives of the perpetrator drug, and recovery takes 5 half-lives after discontinuation.
Emergency Toxicity Management Protocols
-
Acetaminophen Overdose in Chronic Alcoholics
- Toxic threshold: 4-6 grams (vs 10-15 grams in normal patients)
- Mechanism: CYP2E1 induction increases NAPQI formation
- Treatment: N-acetylcysteine within 8 hours, extended protocol
-
**Irinotecan Severe Diarrhea (UGT1A128/28)
- Recognition: Grade 3-4 diarrhea within 24-48 hours
- Management: Aggressive fluid replacement, loperamide, hospitalization
- Prevention: Genetic testing before first dose
-
Warfarin Over-anticoagulation (Multiple Gene Variants)
- Recognition: INR >5 with standard dosing
- Management: Vitamin K 2.5-5 mg PO, hold warfarin, daily INR
- Restart: 50% dose reduction when INR <3
💡 Master This: Metabolic mastery combines pattern recognition (genetic + clinical clues) with quantitative prediction (dose adjustments + monitoring) to achieve personalized medicine outcomes. The goal is therapeutic optimization while preventing adverse events through proactive assessment rather than reactive management.
These rapid assessment tools enable confident clinical decision-making in complex metabolic scenarios, transforming theoretical knowledge into practical expertise that improves patient outcomes and reduces adverse events.
🎯 Clinical Mastery Arsenal: Rapid Assessment Tools
Unlock the full lesson and continue reading
Signup to continue reading this lesson and unlimited access questions, flashcards, AI notes, and more


Have doubts about this lesson?
Ask Rezzy, your AI Study Partner, to explain anything you didn't understand
Everything you need for NEET-PG prep
Get full Oncourse access with lessons, practice questions, flashcards and AI study tools.
Scan to download app