The horizontal line on either side of rectangles in the Forest plot represent _____
#2
Values such as rank orders, or mild-moderate-severe represent _____ scale data
#3
_____ that involves combining results from multiple studies on a given topic.
#4
Bar graphs can be used for representing _____ scale data that forms discrete categories
#5
The confidence interval is smaller with a _____ sample size.
#6
Histograms can be used for representing _____ scale data that forms continuous categories
#7
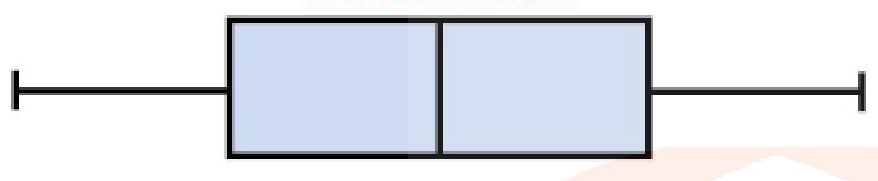
What type of distribution is this?
_____
#8
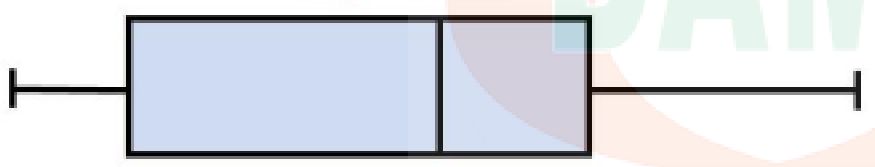
What type of distribution is this?
_____
#9
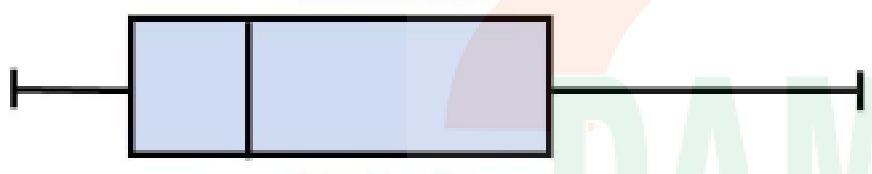
What type of distribution is this?
_____
#10
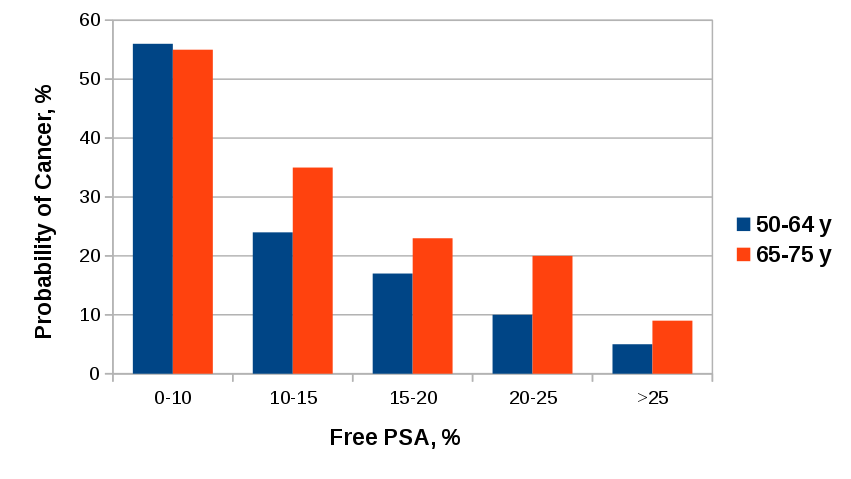
What type of bar graph is represented below?
_____
Collection and Presentation of Data Indian Medical PG Flashcards - Medical Study Cards
Master Collection and Presentation of Data with OnCourse flashcards. These spaced repetition flashcards are designed for medical students preparing for NEET PG, USMLE Step 1, USMLE Step 2, MBBS exams, and other medical licensing examinations.
Collection and Presentation of Data Flashcard Deck - 10 Cards
Flashcard 1: The horizontal line on either side of rectangles in the Forest plot represent _____
Answer: confidence intervals
Flashcard 2: Values such as rank orders, or mild-moderate-severe represent _____ scale data
Answer: ordinal
Flashcard 3: _____ that involves combining results from multiple studies on a given topic.
Answer: Meta-analysis
Flashcard 4: Bar graphs can be used for representing _____ scale data that forms discrete categories
Answer: ordinal/nominal
Flashcard 5: The confidence interval is smaller with a _____ sample size.
Answer: larger (larger/smaller)
Flashcard 6: Histograms can be used for representing _____ scale data that forms continuous categories
Answer: quantitative
Flashcard 7: What type of distribution is this?
_____
Answer: Normal
Flashcard 8: What type of distribution is this?
_____
Answer: Negative/Left
Flashcard 9: What type of distribution is this?
_____
Answer: Positive/Right
Flashcard 10: What type of bar graph is represented below?
_____
Answer: Compound bar graph
Keywords: Collection and Presentation of Data flashcards, medical flashcards, NEET PG preparation, USMLE Step 1 flashcards, Anki alternative, spaced repetition medical, OnCourse flashcards
Want unlimited flashcards?
Get full access to all flashcards, spaced repetition, and progress tracking.