Back
USMLE Step 1 Biostatistics: How Rezzy Study-Mate + Explanation Chat Changes USMLE Prep
Master USMLE Step 1 biostatistics with adaptive practice and AI explanations. Learn high-yield formulas, pattern recognition, and mistake avoidance with a proven 7-day study plan.

USMLE Step 1 Biostatistics: How Rezzy Study-Mate + Explanation Chat Changes USMLE Prep
You are staring at another biostatistics question. The stem mentions sensitivity, specificity, and a 2x2 table. Your brain immediately goes blank. You know there are formulas, but which one applies here? And why does the explanation feel like it was written for statisticians, not med students cramming for Step 1?
USMLE Step 1 biostatistics doesnt have to be your weak spot. The problem isnt that the concepts are impossible — its that traditional study methods treat biostatistics like pure memorization instead of pattern recognition. You memorize 15 different formulas, then panic when the question stem doesnt match your mental template.
Here's what changes the game: adaptive practice that surfaces your specific biostatistics gaps, plus AI explanations that break down the reasoning step-by-step when a standard explanation still doesnt click. Instead of hoping you remember the right formula under pressure, you build intuitive pattern recognition that works across question variations.
Why Students Struggle With USMLE Step 1 Biostatistics
Biostatistics questions have the highest "I knew this but got it wrong" rate on Step 1. You read about sensitivity and specificity 47 times, understand it conceptually, then still pick the wrong answer when they phrase it as "rule out disease" or hide the 2x2 table in a paragraph.
The core issues arent about intelligence or effort:
Formula confusion under pressure. You know sensitivity = TP/(TP+FN), but when the stem talks about "screening test performance" or "diagnostic accuracy," your brain has to translate the clinical language into formula language. Under time pressure, this translation step is where errors happen. Missing the question pattern. USMLE biostatistics questions follow predictable patterns — diagnostic test performance, epidemiological associations, study design identification, and statistical interpretation. But most students study these as separate topics instead of recognizing the underlying patterns that repeat across all four. Shallow explanations that skip steps. Traditional QBank explanations jump straight to "this is sensitivity, use the formula." They dont walk through the reasoning: why this specific metric answers the clinical question, how to extract the 2x2 values from the stem, or what red flags indicate you've misread the question type.
High-Yield Biostatistics Topics for Step 1
Step 1 biostatistics questions cluster around four high-yield areas. Master these patterns and you'll handle 85% of biostatistics questions without memorizing every formula variation.
Diagnostic Test Performance
This is the bread and butter — you'll see 3-4 questions on every Step 1 exam. The key insight: every question is asking about the 2x2 table relationship between test results and actual disease status.
Core concepts:
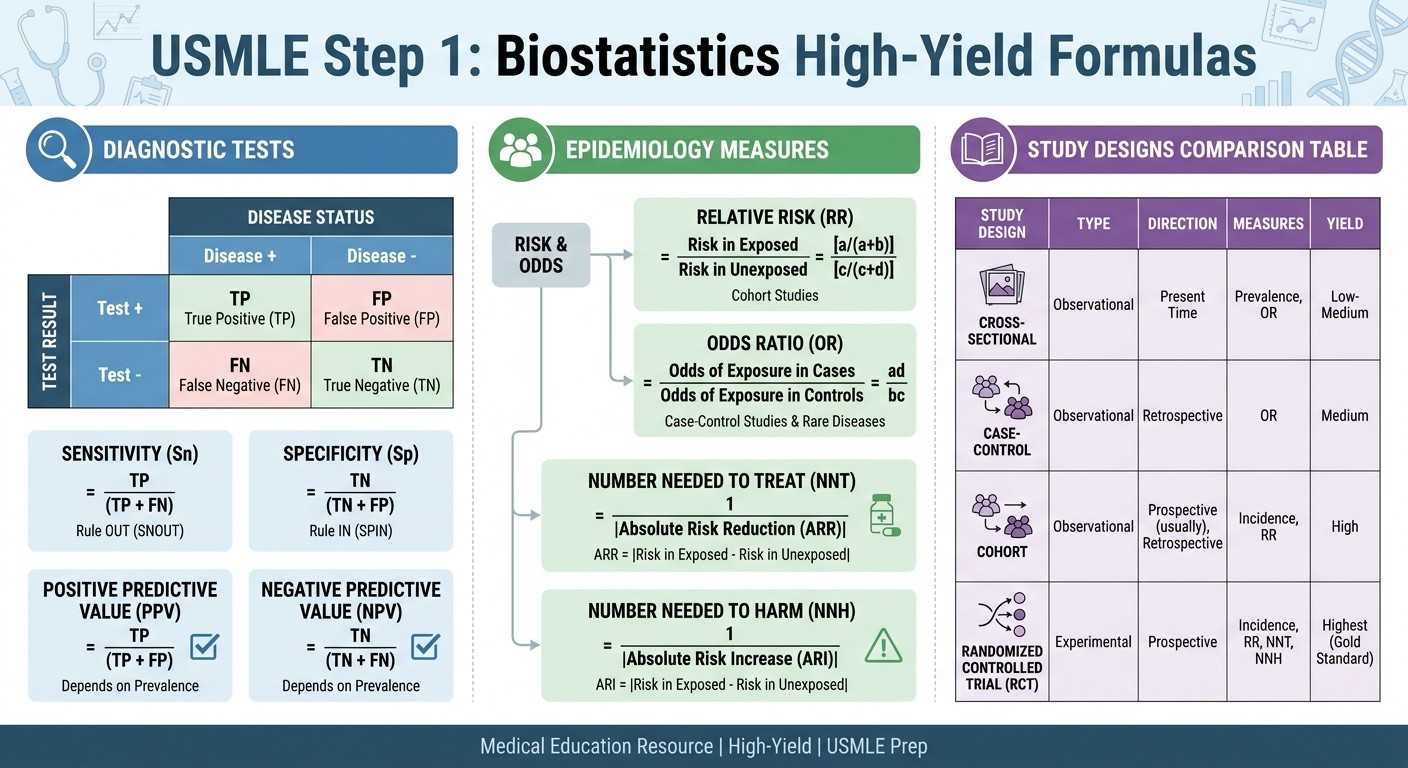
Sensitivity: probability that a diseased patient tests positive (TP/TP+FN)
Specificity: probability that a non-diseased patient tests negative (TN/TN+FP)
PPV: probability that a positive test indicates disease (TP/TP+FP) — depends on prevalence
NPV: probability that a negative test rules out disease (TN/TN+FN) — depends on prevalence
Pattern recognition tip: Questions asking about "ruling out disease" or "screening" want sensitivity. Questions about "confirming diagnosis" or "ruling in disease" want specificity. When you see prevalence mentioned, they want PPV or NPV.
Practice with USMLE biostatistics sensitivity/specificity questions to build recognition speed for these question patterns.
Epidemiological Measures
These questions test your ability to interpret study results and calculate risk associations. The key is recognizing whether the study design gives you rates (cohort) or odds (case-control).
Essential measures:
Relative Risk (RR): risk in exposed/risk in unexposed — only from cohort studies
Odds Ratio (OR): odds in exposed/odds in unexposed — from case-control studies
Absolute Risk Reduction (ARR): control event rate minus experimental event rate
Number Needed to Treat (NNT): 1/ARR — how many patients you treat to prevent one event
Quick interpretation rules:
RR or OR = 1 means no association
RR or OR > 1 means increased risk with exposure
RR or OR < 1 means protective effect
Lower NNT = more effective intervention
Study Design Recognition
Step 1 loves testing your ability to identify study types from clinical scenarios. Each design has specific strengths, limitations, and bias patterns.
Key study types:
RCT: randomization reduces bias, can establish causation
Cohort: follows people over time, measures incidence, establishes temporality
Case-control: starts with outcome, looks backward at exposures, efficient for rare diseases
Cross-sectional: snapshot in time, measures prevalence, cant establish causation
When Rezzy helps you work through study design questions, it focuses on the decision tree: what does the study start with (exposure vs outcome), what direction does it go (forward vs backward in time), and what can it actually prove?
Statistical Inference
These questions test p-values, confidence intervals, Type I and Type II errors, and power calculations. The pattern: theyre asking whether observed differences are likely due to chance.
Core concepts:
p-value: probability of seeing this result if null hypothesis is true
95% CI: range that captures the true value 95% of the time
Type I error (α): false positive — saying theres a difference when there isnt
Type II error (β): false negative — missing a real difference
Power (1-β): ability to detect a true difference
Interpretation shortcuts:
p < 0.05 suggests statistical significance
CI that includes 1 (for RR/OR) or 0 (for mean differences) suggests no significant difference
Wider CI suggests more uncertainty
How Rezzy Study-Mate Changes Biostatistics Learning
Traditional biostatistics study feels like memorizing a phone book. Rezzy turns it into a conversation where you can ask follow-up questions until the concept actually clicks.
Here's how it works differently. You miss a sensitivity/specificity question. Instead of reading a generic explanation about "TP/(TP+FN)," you can ask Rezzy: "Why is this asking for sensitivity instead of specificity?" or "How do I know this is a 2x2 table question from the stem?"
Rezzy gives you the reasoning bridge that textbook explanations skip. It explains why the clinical scenario (ruling out disease in a screening context) translates to the statistical concept (sensitivity), and how to spot that pattern in future questions.
For complex topics like likelihood ratios or confidence interval interpretation, Rezzy breaks down the step-by-step thinking instead of dumping formulas. When a biostatistics explanation still doesnt make sense after reading it twice, you can continue the conversation: "Can you give me another example?" or "What would change if the prevalence was different?"
Explanation Chat: Following Up When You're Still Lost
The biggest gap in traditional QBank study: you read the explanation, still dont fully get it, but have nowhere to go for clarification. You either pretend you understand or waste time searching for alternative explanations.
Explanation Chat closes that loop. When you miss a biostatistics question, you can ask specific follow-up questions right in the moment:
"Why is this NNT instead of NNH?"
"How do I quickly identify case-control vs cohort from the stem?"
"What does it mean when they say 'statistically significant' but the effect size is small?"
The AI explains the reasoning in different ways until you actually get it, instead of moving on with partial understanding that'll hurt you on similar questions later.
For biostatistics, this is especially powerful because students often understand the individual pieces (what sensitivity means) but struggle with the synthesis (why this clinical scenario calls for sensitivity). Explanation Chat helps you connect those dots through targeted questions.
Adaptive Practice: Surfacing Your Biostatistics Blind Spots
Most students practice biostatistics randomly — a sensitivity question here, an NNT calculation there. You never know if youve actually mastered the topic or just got lucky with question selection.
Oncourse's adaptive practice tracks your performance across biostatistics subtopics and surfaces patterns in your mistakes. Missing sensitivity questions but nailing specificity? The system routes more sensitivity practice your way, with varied question stems that test the same underlying concept.
Getting tripped up by NNT vs NNH distinctions? Adaptive practice gives you side-by-side comparisons and similar scenarios until you can quickly identify which metric the question wants.
This targeted approach works because biostatistics learning follows specific progression patterns. You need to master 2x2 table setup before tackling likelihood ratios. You need solid RR vs OR understanding before handling adjusted analyses. Adaptive practice sequences your weak areas in the right order.
Question Pattern Recognition System
Step 1 biostatistics questions use predictable language patterns to signal which concept theyre testing. Instead of memorizing every possible phrasing, learn to recognize the underlying patterns.
Diagnostic Test Patterns
Sensitivity signals:
"screening test"
"ruling out disease"
"catching all cases"
"false negative rate"
Specificity signals:
"confirmatory test"
"ruling in disease"
"avoiding false alarms"
"false positive rate"
PPV/NPV signals:
mentions disease prevalence
"likelihood that positive test indicates disease"
"probability that negative test rules out condition"
Study Design Patterns
RCT signals:
"randomly assigned"
"placebo-controlled"
"double-blind"
participants allocated to treatment groups
Cohort signals:
"followed over time"
"tracked for X years"
starts with exposure status
measures incidence
Case-control signals:
"patients with condition X were compared to controls"
starts with outcome status
looks backward at exposures
efficient for rare diseases
Statistical Significance Patterns
Confidence interval focus:
"95% confidence interval"
"range of plausible values"
CI includes 1 (no effect for ratios) or 0 (no effect for differences)
p-value focus:
"statistical significance"
"probability this occurred by chance"
p < 0.05 threshold
Build your pattern recognition with targeted practice using USMLE biostatistics practice questions that train you to spot these language cues quickly.
Common Biostatistics Mistakes and How to Avoid Them
Even students who understand biostatistics concepts make predictable mistakes under exam pressure. Here are the highest-yield error patterns and how to catch them.
2x2 Table Setup Errors
The mistake: Mislabeling rows and columns when setting up your 2x2 table. You put disease status in rows when it should be in columns, then calculate wrong values. The fix: Always use the same orientation. Disease status (present/absent) in columns, test result (positive/negative) in rows. Write it the same way every time until its automatic. Quick check: After filling your 2x2 table, verify that sensitivity + (1-sensitivity) = 1 and specificity + (1-specificity) = 1. If not, you mislabeled something.
RR vs OR Confusion
The mistake: Using relative risk formulas with case-control data, or odds ratio interpretation with cohort data. The fix: Study design determines the measure. Cohort studies (follow people forward) give you RR. Case-control studies (start with outcomes) give you OR. Quick check: If the question describes selecting cases and controls, use OR. If it describes following exposed and unexposed groups, use RR.
NNT vs NNH Mix-ups
The mistake: Using NNT formula when the question asks about harm, or vice versa. The fix: NNT uses absolute risk reduction (control rate - treatment rate). NNH uses absolute risk increase (treatment rate - control rate). Pay attention to whether the outcome is beneficial or harmful. Quick check: NNT should be interpreted as "treat X patients to prevent one bad outcome." NNH should be "treat X patients to cause one additional bad outcome."
Prevalence and Predictive Values
The mistake: Forgetting that PPV and NPV depend on disease prevalence, while sensitivity and specificity dont. The fix: When prevalence increases, PPV increases and NPV decreases. When prevalence decreases, PPV decreases and NPV increases. Quick check: If the question mentions population prevalence or asks about "different settings," theyre testing PPV/NPV concepts.
7-Day Biostatistics Intensive Practice Plan
This focused plan targets the highest-yield biostatistics concepts through daily themed practice. Each day builds on previous concepts while adding complexity.
Day 1: 2x2 Table Mastery
Morning: Practice setting up 2x2 tables from question stems (20 questions)
Focus: Speed and accuracy in labeling disease/no disease vs test+/test-
Goal: Set up any 2x2 table in under 30 seconds
Evening review: Check your 2x2 setup process with biostatistics flashcards for quick formula recall
Day 2: Sensitivity and Specificity
Morning: Pure sensitivity/specificity calculations (25 questions)
Focus: Recognizing when questions ask for ruling in vs ruling out
Rezzy practice: Ask "How do I know this wants sensitivity?" for missed questions
Goal: 90% accuracy on sensitivity/specificity identification
Day 3: Predictive Values and Prevalence
Morning: PPV/NPV questions with varying prevalence (20 questions)
Focus: Understanding how prevalence shifts predictive values
Practice pattern: Same test, different populations, different PPV/NPV
Goal: Predict PPV/NPV direction before calculating
Day 4: Relative Risk and Odds Ratios
Morning: RR/OR calculations from cohort and case-control studies (25 questions)
Focus: Matching the right measure to study design
Key insight: OR approximates RR when disease is rare (<10%)
Goal: Distinguish cohort vs case-control from question stems alone
Day 5: NNT and Clinical Decision Making
Morning: NNT/NNH calculations with clinical interpretation (20 questions)
Focus: Absolute risk reduction vs relative measures
Practice: Compare interventions using NNT values
Goal: Interpret NNT in clinical context, not just calculate
Day 6: Study Design Recognition
Morning: Mixed study design questions (30 questions)
Focus: RCT vs cohort vs case-control vs cross-sectional identification
Pattern practice: Match biases to study types
Goal: Identify study design from first sentence of stem
Day 7: Mixed Practice and Weak Areas
Morning: Comprehensive biostatistics question set (40 questions)
Adaptive focus: Use weak-area analytics to target your lowest-scoring topics
Explanation Chat: Follow up on any questions still causing confusion
Goal: Consistent performance across all biostatistics question types
Daily routine:
45 minutes focused practice each morning
15 minutes Explanation Chat follow-up on missed questions
10 minutes evening formula review using spaced repetition
Track mistakes by category (formula error, misread question, concept gap)
Converting Biostatistics Knowledge Into Step 1 Points
Biostatistics offers one of the highest point-per-hour ratios on Step 1. Unlike anatomy or physiology, biostatistics concepts are finite and highly testable. Master the core patterns and formulas, and you can reliably score 85-90% on biostatistics questions.
The key is shifting from passive review to active problem-solving. Instead of reading about sensitivity and specificity, practice extracting 2x2 tables from complex clinical scenarios. Instead of memorizing NNT formulas, work through clinical decision-making scenarios where NNT guides treatment choices.
Use your biostatistics practice performance as a proxy for your overall Step 1 readiness. When you can consistently identify question patterns, set up calculations correctly, and interpret results in clinical context, youve developed the systematic thinking that transfers to other Step 1 topics.
For comprehensive biostatistics preparation, work through the complete USMLE Step 1 biostatistics lessons that cover both foundational concepts and advanced applications.
Frequently Asked Questions
How many biostatistics questions are on Step 1?
Typically 8-12 questions per exam, making it roughly 3-4% of your total score. Given the high accuracy potential once you master the patterns, biostatistics offers excellent return on study time investment.
Should I memorize all biostatistics formulas?
No. Focus on understanding the underlying concepts and recognizing question patterns. You need about 10 core formulas (sensitivity, specificity, RR, OR, NNT) plus the ability to set up 2x2 tables quickly. Everything else builds from these fundamentals.
What's the difference between biostatistics and epidemiology on Step 1?
Biostatistics focuses on statistical methods and calculations (sensitivity, NNT, confidence intervals). Epidemiology focuses on study design, bias recognition, and population health measures. Theres significant overlap, and many questions test both simultaneously.
How do I know when to use RR vs OR?
Study design determines this. Cohort studies (following people forward in time) calculate relative risk. Case-control studies (starting with outcomes and looking backward) calculate odds ratios. The question stem will indicate the study approach.
Why do my biostatistics scores vary so much between practice sessions?
Biostatistics performance is highly dependent on careful reading and systematic calculation. Score variation usually indicates inconsistent question-reading technique or rushed calculations. Focus on developing a repeatable approach to each question type.
Should I use a calculator for biostatistics questions?
Use the provided calculator for complex calculations, but develop mental math skills for simple ratios. Most Step 1 biostatistics questions use round numbers that allow quick mental calculation, and speed matters for finishing the exam.
Prepare smarter with Oncourse AI — adaptive MCQs, spaced repetition, and AI explanations built for USMLE Step 1. Download free on Android and iOS.