USMLE Step 1 Biostatistics: How Rezzy Tutor + Explanation Chat Changes USMLE Prep
Master USMLE Step 1 biostatistics with AI-powered tutoring. Learn sensitivity, specificity, NNT/NNH, and study design through adaptive practice and instant explanations that build confidence.

USMLE Step 1 Biostatistics: How Rezzy Tutor + Explanation Chat Changes USMLE Prep
You open a biostatistics question. 63 seconds tick by. The question stem mentions a screening test with 85% sensitivity and 92% specificity in a population with 2% disease prevalence. What's the positive predictive value?
Your brain freezes. Not because you dont know the formula — you've memorized PPV = TP/(TP+FP) a dozen times. But translating those percentages into actual numbers, setting up the 2x2 table, and calculating without arithmetic errors under time pressure? That's where most students stumble.
USMLE Step 1 biostatistics isn't about memorizing definitions. It's about rapid pattern recognition, flawless calculation, and understanding what the numbers actually mean clinically. The students who nail these questions don't just know formulas — they've developed intuitive feel for when sensitivity matters more than specificity, why prevalence destroys your PPV calculations, and how to spot the reasoning traps NBME loves to set.
Here's how modern AI tutoring changes everything about biostatistics prep, and why the traditional "memorize and pray" approach keeps students stuck in the 220s when they need to break 240.
Why USMLE Step 1 Biostatistics Questions Feel Impossible
Pattern #1: The Formula Trap
You memorize sensitivity = TP/(TP+FN). The question gives you percentages and prevalence. You freeze because bridging from formula to calculation requires setting up hypothetical populations — something most resources never teach explicitly.
Pattern #2: The Context Switch
Question 47 asks about screening mammography. Question 48 asks about diagnosing strep throat. Question 49 asks about evaluating a cardiac stress test. Same formulas, different clinical contexts. Your brain treats each as a separate problem instead of recognizing the underlying statistical pattern.
Pattern #3: The Reasoning Trap
NBME writers know students confuse odds ratios with relative risk. They know you'll mix up incidence and prevalence. They know you'll forget that NNT depends on baseline risk. Every answer choice targets a specific misconception.
The traditional approach — reading First Aid, watching Khan Academy, doing UWorld — addresses these patterns separately. You learn formulas in one resource, see calculations in another, and encounter clinical applications in a third. Your brain never connects the dots under test conditions.
The Feedback Loop Problem in Biostatistics Study
Here's what happens when you miss a biostatistics question:
1. You read the explanation — usually a paragraph restating the formula and showing the arithmetic
2. You think you understand — the math makes sense when someone else does it
3. You encounter a similar question next week — and make the exact same mistake
4. You blame your memory — "I just need to drill these formulas more"
The problem isn't your memory. It's that traditional explanations don't address why you made that specific error or how to recognize similar traps in different contexts.
When Rezzy's conversational tutoring walks through a biostatistics explanation that still doesn't click, it doesn't just repeat the same calculation. It asks: "Which part specifically confuses you — setting up the 2x2 table, or converting percentages to actual numbers?" Then it gives you a step-by-step breakdown tailored to exactly where your understanding breaks down.
High-Yield USMLE Step 1 Biostatistics Formulas That Actually Matter
Stop trying to memorize every statistical test. Focus on the 12 formulas that show up repeatedly:
Diagnostic Test Performance
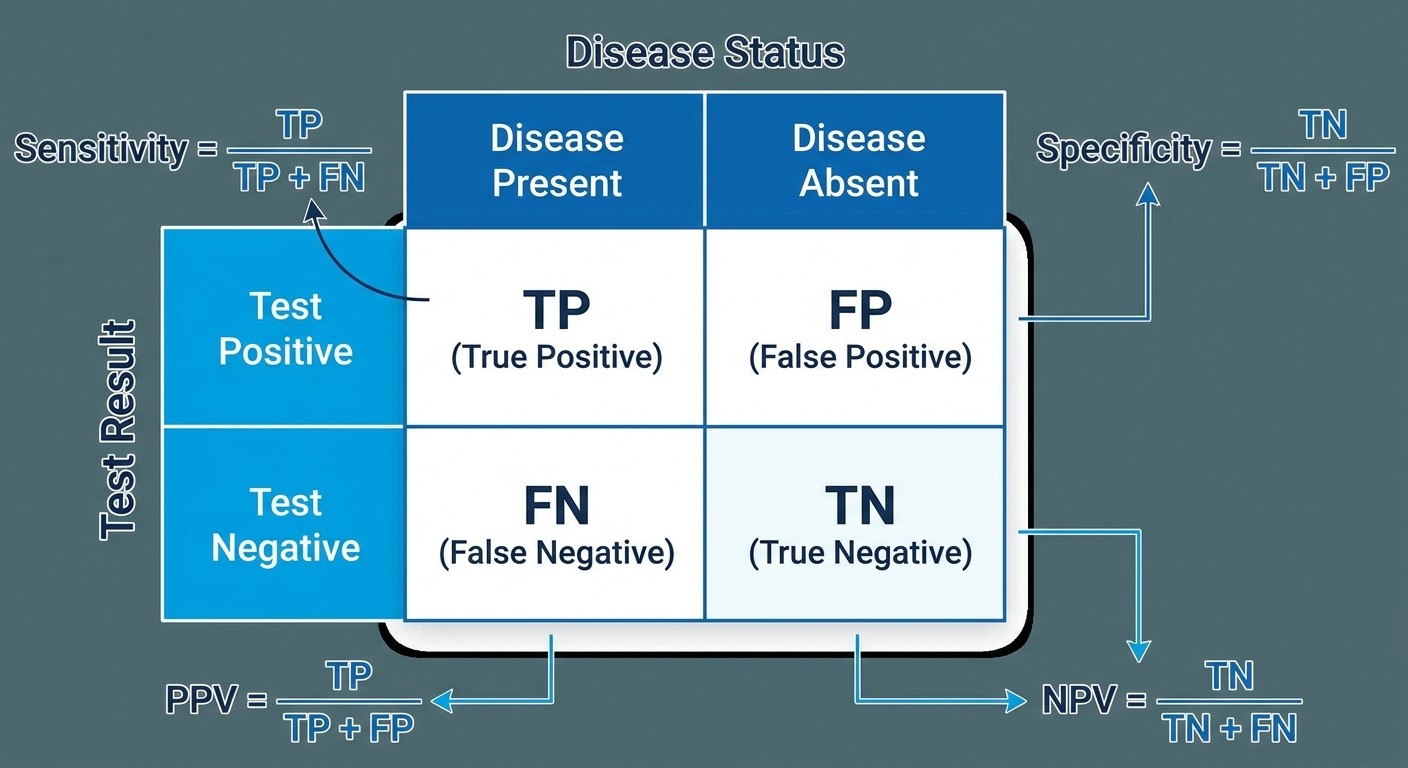
Metric | Formula | What It Tells You |
|---|---|---|
Sensitivity | TP/(TP+FN) | How well test catches disease (rule OUT when negative) |
Specificity | TN/(TN+FP) | How well test excludes disease (rule IN when positive) |
PPV | TP/(TP+FP) | If test positive, probability of disease |
NPV | TN/(TN+FN) | If test negative, probability of no disease |
Accuracy | (TP+TN)/Total | Overall test correctness |
The SNOUT/SPIN Rule
SNsitive test — Negative result rules OUT disease
SPecific test — Positive result rules IN disease
Treatment Effect Calculations
Metric | Formula | Interpretation |
|---|---|---|
Absolute Risk Reduction (ARR) | Control Event Rate - Treatment Event Rate | Real-world benefit |
Number Needed to Treat (NNT) | 1/ARR | Patients to treat for 1 benefit |
Number Needed to Harm (NNH) | 1/Absolute Risk Increase | Patients to treat for 1 harm |
Relative Risk (RR) | Risk in Exposed/Risk in Unexposed | Fold-increase in risk |
Odds Ratio (OR) | (a×d)/(b×c) from 2x2 table | Association strength |
Quick Recognition: Cohort studies → calculate RR. Case-control studies → calculate OR. Clinical trials → calculate NNT/NNH.
When you're working through these calculations and the setup still feels fuzzy, Rezzy can break down the exact steps — from identifying study design to choosing the right formula to avoiding arithmetic traps.
USMLE Question Pattern Recognition for Biostatistics
Screening Test Questions (High Sensitivity Focus)
Stem mentions: "screening," "population-based," "asymptomatic patients"
Usually asks about PPV/NPV or "what happens if prevalence changes"
Key insight: Low prevalence destroys PPV, even with great test characteristics
Diagnostic Test Questions (High Specificity Focus)
Stem mentions: "confirmatory test," "gold standard," "ruling in disease"
Often includes likelihood ratios or post-test probability
Key insight: High specificity prevents false positives in diagnostic workup
Treatment Benefit Questions (NNT/NNH Focus)
Stem gives control group vs treatment group event rates
Asks "how many patients need treatment" or "clinical significance"
Key insight: Small relative benefits can have large NNTs, questioning clinical value
Study Design Questions (Bias and Validity Focus)
Describes study methodology, asks about limitations or bias type
Key insight: Match bias type to study design (recall bias in case-control, loss to follow-up in cohort)
The pattern recognition comes from seeing hundreds of questions, but understanding why NBME frames questions this way requires someone to explain the clinical logic behind each setup.
The AI Explanation Advantage: Learning From Your Specific Mistakes
Traditional question banks give you generic explanations. When you miss a biostatistics question, you get the same paragraph every student gets. But your mistake might be completely different from someone else's.
Student A missed the question because they confused sensitivity with PPV. Student B missed it because they set up the 2x2 table wrong. Student C missed it because they didn't recognize this was asking about screening performance.
One explanation can't address three different error patterns. That's where Explanation Chat comes in — you can ask follow-up questions about the exact point where your reasoning went wrong.
"I calculated sensitivity correctly as 85%, but I don't understand why the PPV is so low when the test seems good."
"The issue is prevalence. In a population where only 2% have disease, even a great test will have more false positives than true positives. Want me to show you the actual numbers?"
This back-and-forth tutoring approach means you're not just getting the right answer — you're understanding the clinical reasoning that makes biostatistics questions predictable.
Common USMLE Step 1 Biostatistics Mistakes and How to Avoid Them
Mistake #1: Confusing Prevalence-Dependent vs Prevalence-Independent Measures
What students think: "High sensitivity means high PPV" Reality: PPV depends on disease prevalence. Sensitivity doesn't. How to avoid: Always ask "does this measure change if I test a different population?" Sensitivity and specificity are test characteristics — they don't change. PPV and NPV are population-dependent — they change with prevalence.
Mistake #2: Mixing Up When to Use OR vs RR
What students think: "These formulas are basically the same thing" Reality: OR approximates RR only when disease is rare (<10% prevalence) How to avoid: Look at study design. Cohort study = you can calculate incidence = use RR. Case-control study = you can't calculate incidence = use OR.
Mistake #3: Misinterpreting NNT Clinical Significance
What students think: "Lower NNT is always better" Reality: NNT must be interpreted with baseline risk, time horizon, and harm profile How to avoid: NNT = 5 sounds great, but if baseline risk is 0.1% over 20 years, you're treating 500 people for 20 years to prevent 1 event. Consider the clinical burden.
Mistake #4: P-Value Worship
What students think: "p<0.05 means clinically important" Reality: Statistical significance ≠ clinical significance How to avoid: Always look at effect size and confidence intervals. A statistically significant 1% improvement might be clinically meaningless.
When you're reviewing these mistakes and want to see how they show up in actual question stems, Oncourse's biostatistics practice questions let you drill these specific error patterns until recognition becomes automatic.
7-Day USMLE Step 1 Biostatistics Practice Plan
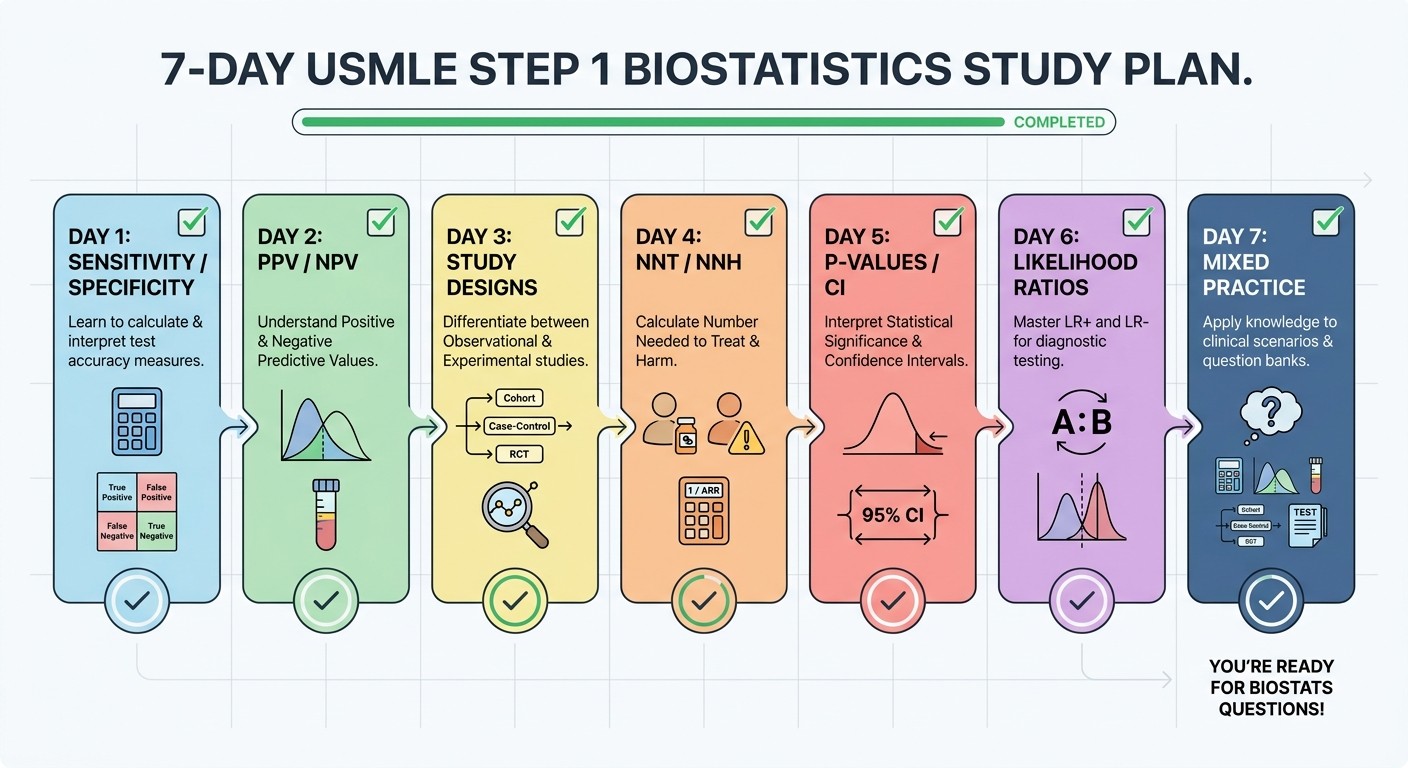
This isn't about cramming formulas. It's about building pattern recognition through structured practice:
Day 1: Sensitivity and Specificity Mastery
Morning (30 minutes): Review USMLE biostatistics lessons on diagnostic test characteristics
Afternoon (45 minutes): Practice 20 questions focusing only on sens/spec calculations
Evening (15 minutes): Create flashcards for SNOUT/SPIN rules
Key Goal: Set up 2x2 tables automatically from any question stem
Day 2: PPV/NPV and Prevalence Effects
Morning: Work through 5 questions where you change prevalence and recalculate PPV/NPV
Afternoon: Focus on screening vs diagnostic test scenarios — when does prevalence matter?
Evening: Review mistakes with explanation chat — ask specific questions about prevalence impact
Key Goal: Predict PPV/NPV direction without calculating when prevalence changes
Day 3: Study Design and Appropriate Measures
Morning: Cohort vs case-control recognition drill
Afternoon: Match study design to correct measure (RR for cohort, OR for case-control)
Evening: Bias identification — what bias affects each study type?
Key Goal: Identify study type and appropriate calculation within 15 seconds
Day 4: NNT/NNH and Clinical Significance
Morning: Calculate NNT from absolute risk reduction tables
Afternoon: Practice interpreting clinical significance — is NNT = 50 worth it?
Evening: Compare relative risk vs absolute risk presentations
Key Goal: Convert between relative and absolute measures fluently
Day 5: P-Values, Confidence Intervals, and Statistical Power
Morning: Interpret confidence intervals that cross vs don't cross null
Afternoon: Distinguish between statistical and clinical significance
Evening: Power calculations and sample size interpretation
Key Goal: Read statistical results and draw appropriate clinical conclusions
Day 6: Likelihood Ratios and Advanced Concepts
Morning: Convert between sensitivity/specificity and likelihood ratios
Afternoon: Use LRs to update pretest to post-test probability
Evening: ROC curves and AUC interpretation
Key Goal: Apply likelihood ratios in sequential testing scenarios
Day 7: Mixed Practice and Error Analysis
Morning: Timed mixed question set (25 questions, 30 minutes)
Afternoon: Review every mistake with AI tutoring — focus on reasoning gaps
Evening: Identify your 3 most common error patterns
Key Goal: Recognize your personal mistake patterns and develop checking strategies
Throughout this week, when specific concepts aren't clicking during practice, having access to conversational tutoring means you can get immediate clarification rather than staying stuck or moving on with gaps in understanding.
How Weak-Area Analytics Transform Biostatistics Study
Most students don't realize they have biostatistics blind spots until they're taking the real exam. Maybe you consistently nail sensitivity/specificity but bomb every NNT question. Maybe you understand cohort studies but case-control questions trip you up every time.
Traditional question banks treat every wrong answer the same. But not all mistakes are created equal — some represent isolated knowledge gaps, others reveal systematic reasoning problems that will show up across multiple topics.
Adaptive weak-area analytics track your performance across biostatistics subtopics and surface patterns you might miss:
Diagnostic Tests: Consistently missing PPV/NPV vs acing sensitivity/specificity = prevalence concept gap
Study Design: Getting cohort studies right but missing case-control = OR vs RR confusion
Treatment Effects: Calculating NNT correctly but choosing wrong answers = clinical significance interpretation problem
The system then routes additional practice toward your specific weak areas, so you're not wasting time drilling concepts you already understand.
When you do hit a persistent weak spot, that's exactly when you'd chat with Rezzy: "I keep getting likelihood ratio questions wrong, even though I know the formulas. What am I missing?" The AI can help identify whether it's a calculation issue, a concept understanding problem, or a pattern recognition gap.
Moving Beyond Memorization: Building Biostatistics Intuition
The difference between students who struggle with biostatistics and those who dominate it isn't memorization — it's intuition. High-scoring students develop a feel for:
When numbers make clinical sense: PPV of 15% for a "good" screening test should trigger "low prevalence population" recognition
Why NBME chose specific answer choices: If options are 0.1%, 2%, 15%, 67%, they're testing your understanding of how prevalence affects predictive values
What matters clinically vs statistically: NNT = 150 over 5 years might be statistically significant but clinically questionable
This intuition develops through feedback loops that traditional studying can't provide. You need to make mistakes, understand why you made them, adjust your approach, and test the adjustment immediately.
That's exactly what AI-powered tutoring enables. Instead of reading about biostatistics, you're having conversations about it. Instead of memorizing isolated formulas, you're building connected understanding of why these statistical concepts matter in clinical medicine.
Frequently Asked Questions
How long should I spend on biostatistics for USMLE Step 1?
Plan 2-3 weeks of dedicated biostatistics study if you're starting from scratch, or 4-5 days for review if you have solid foundations. The key is consistent daily practice rather than marathon sessions — biostatistics requires pattern recognition that builds over time.
What's the highest-yield biostatistics topic for Step 1?
Sensitivity, specificity, PPV, and NPV questions appear most frequently, followed closely by study design recognition (cohort vs case-control) and NNT/NNH calculations. Master diagnostic test characteristics first, then expand to treatment effect measures.
Should I memorize all the biostatistics formulas?
Memorize the core formulas (sensitivity, specificity, PPV, NPV, NNT, RR, OR) but focus more on when to use each one. NBME questions test application and interpretation more than pure calculation — knowing when prevalence affects PPV matters more than memorizing the formula.
How do I avoid arithmetic errors in biostatistics calculations?
Write out your 2x2 tables on the scratch board, double-check your basic arithmetic, and verify your answer makes clinical sense. If you calculate a PPV of 85% for a screening test in a low-prevalence population, something's wrong with your calculation.
What's the difference between biostatistics on Step 1 vs Step 2 CK?
Step 1 biostatistics focuses on test characteristics, study design, and basic statistical interpretation. Step 2 CK incorporates more clinical decision-making — using test results to guide management rather than just calculating the statistics.
How can I practice biostatistics efficiently?
Use spaced repetition for formulas, but spend most time on mixed question practice that mirrors exam conditions. Focus on identifying question patterns quickly, then apply the appropriate approach. Review mistakes immediately with detailed explanations rather than just moving to the next question.
Transform Your Biostatistics Prep Today
USMLE Step 1 biostatistics doesn't have to be the section you dread. With the right approach — pattern recognition over memorization, personalized feedback over generic explanations, and adaptive practice over random drilling — these questions become as predictable as any other Step 1 topic.
The students breaking 240+ aren't smarter than you. They're just studying smarter, with tools that adapt to their specific learning needs and fill gaps in real-time rather than leaving confusion to compound over weeks of study.
Prepare smarter with Oncourse AI — adaptive MCQs, spaced repetition, and AI explanations built for USMLE Step 1. Download free on Android and iOS.