
General Pathology

On this page
🔬 Cellular Injury Fundamentals: The Damage Control Center
Every disease begins with cellular disruption, and understanding how cells respond to injury, die, and trigger inflammation forms the foundation of all clinical reasoning. You'll master the molecular mechanisms behind apoptosis and necrosis, decode the inflammatory cascade that orchestrates healing or harm, and learn to recognize pathological patterns that guide diagnosis across organ systems. By integrating cellular events with multi-system disease processes, you'll build the diagnostic and therapeutic framework essential for clinical decision-making in any specialty.
Cellular Injury Classification Matrix
| Injury Type | Reversibility | Timeline | Key Features | Clinical Examples |
|---|---|---|---|---|
| Hydropic | Reversible | Minutes-Hours | Swelling, ↑Na+/K+ pump failure | Ischemia, hypoxia |
| Fatty Change | Reversible | Hours-Days | Lipid accumulation, ↓β-oxidation | Alcohol, diabetes |
| Coagulative | Irreversible | 6-24 hours | Protein denaturation, architecture preserved | MI, stroke |
| Liquefactive | Irreversible | 24-72 hours | Enzymatic digestion, cavity formation | Brain infarct, abscess |
| Caseous | Irreversible | Days-Weeks | Cheese-like, granulomatous | TB, fungal infections |
Molecular Damage Mechanisms
-
ATP Depletion Cascade
- Normal ATP: 5-10 mM intracellular
- Critical threshold: <25% of normal levels
- Na+/K+ pump failure occurs within 2-5 minutes
- Cellular swelling (hydropic change)
- Loss of membrane potential (-70mV → -20mV)
- Calcium influx activation
-
Free Radical Injury
- Superoxide (O2•-): 10^9 molecules/cell/day production
- Hydroxyl radical (•OH): Most damaging, 10^-9 second half-life
- DNA strand breaks within microseconds
- Lipid peroxidation chain reactions
- Protein oxidation and cross-linking
⭐ Clinical Pearl: 85% of reperfusion injury results from free radical generation, not the initial ischemia itself
- Calcium Overload Pathways
- Normal cytosolic Ca2+: 100 nM
- Lethal threshold: >1 μM sustained elevation
- Activates phospholipases, proteases, endonucleases within minutes
- Membrane phospholipid breakdown
- Cytoskeletal protein degradation
- Nuclear chromatin fragmentation
💡 Master This: ATP depletion → Na+/K+ pump failure → Ca2+ influx → enzyme activation → irreversible damage. This sequence explains why early reperfusion (within 6 hours) prevents progression from reversible to irreversible injury.
📌 Remember: CAFE - Calcium ATP Free radicals Enzymes - the four horsemen of cellular death
Understanding these injury mechanisms provides the foundation for recognizing how cellular stress patterns manifest as tissue-level pathological changes, setting the stage for mastering inflammation and repair responses.
🔬 Cellular Injury Fundamentals: The Damage Control Center


⚡ Apoptosis vs Necrosis: The Cellular Death Duel
Death Pathway Discrimination Matrix
| Feature | Apoptosis | Necrosis | Clinical Significance |
|---|---|---|---|
| Energy | ATP-dependent | ATP-independent | Determines reversibility window |
| Membrane | Intact, phosphatidylserine flip | Disrupted, permeable | Inflammatory response trigger |
| DNA | Ladder pattern (180bp) | Random fragmentation | Diagnostic gel electrophoresis |
| Inflammation | Minimal (silent death) | Intense (danger signals) | Treatment strategy selection |
| Reversibility | Committed at caspase-3 | Variable until membrane loss | Therapeutic intervention timing |
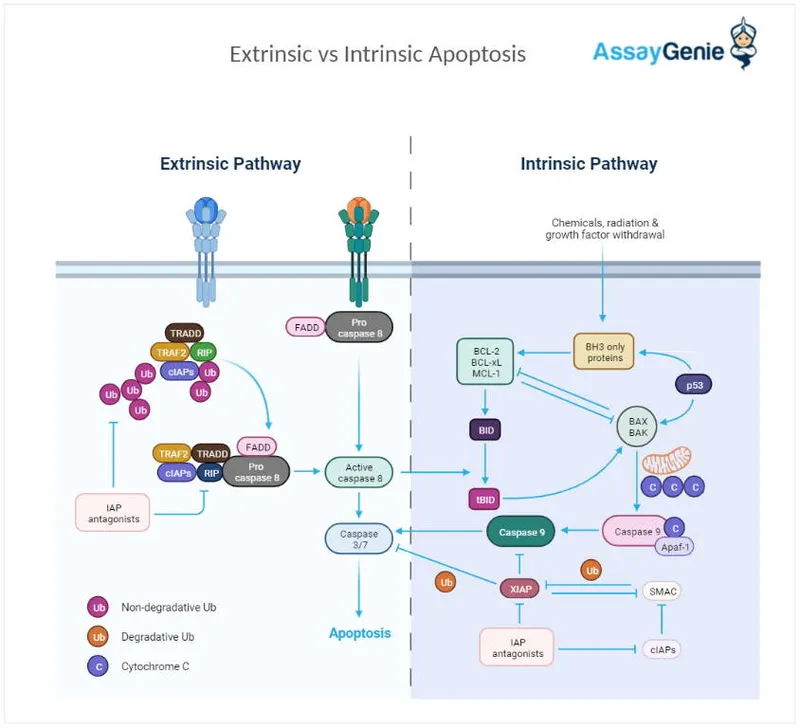
Apoptotic Machinery Architecture
-
Intrinsic Pathway (Mitochondrial)
- Triggered by DNA damage, hypoxia, growth factor withdrawal
- p53 activation threshold: >20 DNA double-strand breaks
- Bax/Bak oligomerization creates 2-3 nm pores in mitochondria
- Cytochrome c release within 30 minutes
- Apoptosome formation (cytochrome c + Apaf-1 + caspase-9)
- Caspase-3 activation cascade
-
Extrinsic Pathway (Death Receptor)
- Fas, TNF-α, TRAIL receptor activation
- Death-inducing signaling complex (DISC) formation
- Direct caspase-8 activation within 5-10 minutes
- Bypasses mitochondrial checkpoints
- Rapid execution phase (<2 hours)
- Bid cleavage amplifies through intrinsic pathway
⭐ Clinical Pearl: Bcl-2/Bax ratio >2 predicts chemotherapy resistance in 75% of lymphomas, as cells cannot execute apoptosis despite DNA damage
Necrosis Pattern Recognition
-
Coagulative Necrosis
- Protein denaturation predominates over enzymatic digestion
- Tissue architecture preserved for 3-7 days
- Classic in: Heart (MI), kidney (infarct), liver (ischemia)
- Ghost cell outlines visible
- Nuclear changes: pyknosis → karyorrhexis → karyolysis
- 6-12 hour delay before histological changes
-
Liquefactive Necrosis
- Enzymatic digestion predominates
- Tissue architecture completely lost
- Brain infarcts: 24-48 hours to liquefaction
- High lipid content accelerates breakdown
- Microglial activation releases proteases
- Cystic cavity formation within weeks
💡 Master This: Coagulative necrosis preserves tissue architecture because protein denaturation blocks enzymatic digestion, while liquefactive necrosis occurs where high enzyme concentrations (brain, neutrophils) overwhelm structural proteins.
⭐ Clinical Pearl: Caspase-3 immunostaining distinguishes apoptosis from necrosis in >95% of cases, crucial for determining whether cell death resulted from programmed elimination or pathological injury.
This death pathway mastery enables recognition of tissue injury patterns and guides therapeutic interventions targeting specific cellular death mechanisms.
⚡ Apoptosis vs Necrosis: The Cellular Death Duel


🌊 Inflammation Orchestration: The Immune Response Command Center
Inflammatory Response Timeline Matrix
| Phase | Duration | Key Players | Molecular Signals | Clinical Manifestations |
|---|---|---|---|---|
| Initiation | 0-30 minutes | Mast cells, complement | Histamine, C3a, C5a | Vasodilation, ↑permeability |
| Amplification | 30min-6hrs | Neutrophils, platelets | IL-1β, TNF-α, LTB4 | Pain, swelling, heat |
| Resolution | 6-48 hours | Macrophages, eosinophils | IL-10, TGF-β, lipoxins | Tissue repair initiation |
| Chronic | >48 hours | Lymphocytes, plasma cells | IFN-γ, IL-17, IL-4 | Fibrosis, granuloma formation |
Vascular Response Mechanisms
-
Vasodilation Cascade
- Histamine release: 10-100 ng/mL plasma levels
- Nitric oxide production: ↑500% within 5 minutes
- Prostaglandin E2: Peak at 15-30 minutes
- Arteriolar smooth muscle relaxation
- Blood flow increase: 300-500% above baseline
- Temperature elevation: 1-2°C locally
-
Permeability Changes
- Immediate phase: 0-30 minutes (histamine-mediated)
- Delayed phase: 4-12 hours (cytokine-mediated)
- Endothelial gap formation: 0.1-1 μm intercellular spaces
- Protein extravasation increases 10-fold
- Oncotic pressure gradient reversal
- Edema formation within minutes
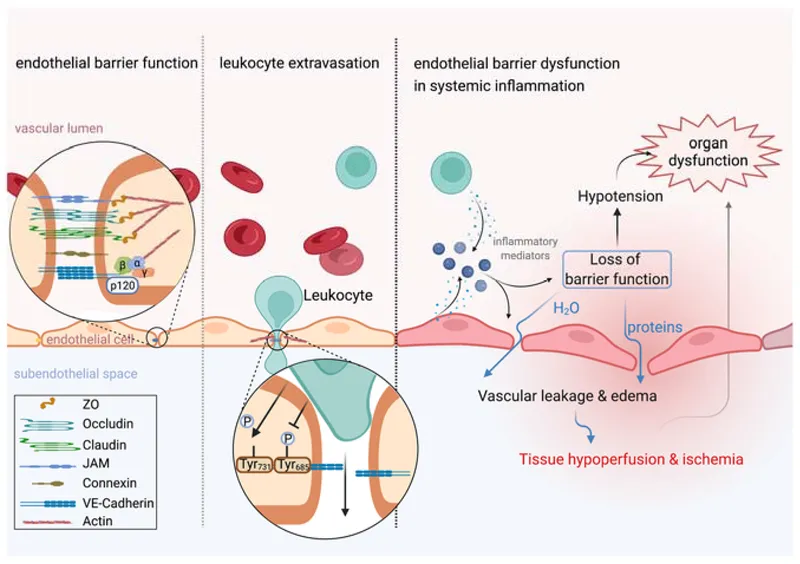
⭐ Clinical Pearl: Starling forces reverse during inflammation - hydrostatic pressure (35 mmHg) plus ↓oncotic pressure (15 mmHg) drives massive fluid extravasation
Cellular Recruitment Architecture
-
Neutrophil Mobilization
- Bone marrow release: ↑10-fold within 4-6 hours
- Rolling velocity: 50-100 μm/second on selectins
- Firm adhesion: <5 seconds via integrin activation
- Selectin-mediated capture and rolling
- Chemokine-triggered integrin activation
- Transmigration through 2-5 μm endothelial gaps
-
Monocyte-Macrophage Transition
- Recruitment peak: 24-48 hours post-injury
- Tissue residence: Weeks to months
- Phenotype switching: M1 (pro-inflammatory) → M2 (anti-inflammatory)
- M1 markers: iNOS, IL-1β, TNF-α
- M2 markers: Arginase-1, IL-10, TGF-β
- Switch occurs at 48-72 hours
📌 Remember: SMART neutrophils - Selectin rolling Margination Adhesion Rolling Transmigration
💡 Master This: The selectin-integrin cascade enables neutrophils to decelerate from 1000 μm/sec (blood flow) to <10 μm/sec (tissue migration) through sequential molecular braking systems.
⭐ Clinical Pearl: C-reactive protein rises 100-1000 fold within 6-12 hours, making it the most sensitive acute-phase reactant for detecting inflammation severity.
This inflammatory orchestration framework reveals how molecular timing determines whether inflammation resolves appropriately or progresses to chronic tissue damage.
🌊 Inflammation Orchestration: The Immune Response Command Center


🔧 Pattern Recognition Mastery: The Diagnostic Decoder
Diagnostic Pattern Recognition Matrix
| Pattern | Key Features | Timeline | Associated Conditions | Diagnostic Accuracy |
|---|---|---|---|---|
| Acute Inflammation | Neutrophil infiltrate, edema | Hours-days | Infection, trauma, ischemia | >95% specificity |
| Chronic Inflammation | Lymphocytes, plasma cells, fibrosis | Weeks-months | Autoimmune, persistent infection | 85-90% sensitivity |
| Granulomatous | Epithelioid cells, giant cells | Weeks-years | TB, sarcoidosis, foreign body | 90-95% specificity |
| Neoplastic | Cellular atypia, mitoses, invasion | Variable | Benign vs malignant tumors | 98% with immunostains |
| Degenerative | Cell loss, fibrosis, calcification | Months-years | Aging, chronic disease | 80-85% correlation |
Inflammatory Pattern Discrimination
-
Acute vs Chronic Inflammation
- Neutrophil predominance: >70% = acute pattern
- Lymphocyte infiltrate: >50% = chronic pattern
- Tissue edema: Prominent in acute, minimal in chronic
- Acute: Vascular changes dominate (minutes to hours)
- Chronic: Cellular infiltrate dominates (days to weeks)
- Mixed: Both patterns present (subacute phase)
-
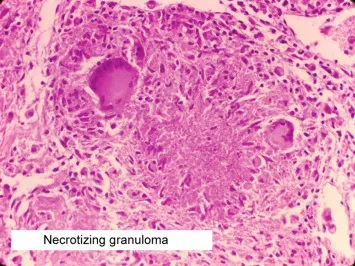
Granulomatous Recognition
- Epithelioid cell clusters: >20 cells per aggregate
- Giant cell types: Langhans (peripheral nuclei) vs foreign body (random nuclei)
- Central necrosis: Caseating (TB) vs non-caseating (sarcoid)
- Caseating: Cheese-like appearance, acid-fast organisms
- Non-caseating: Intact cellular architecture, negative cultures
- Foreign body: Polarizable material under polarized light
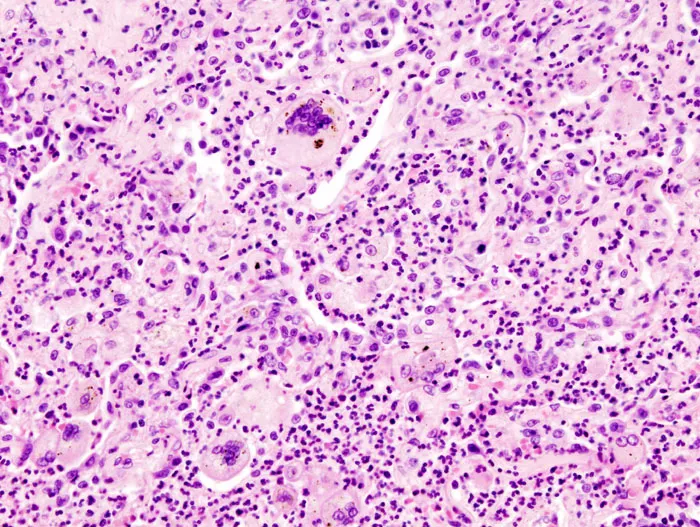
⭐ Clinical Pearl: Langhans giant cells with peripheral nuclei suggest infectious granulomas in 80% of cases, while foreign body giant cells with random nuclei indicate non-infectious causes
Neoplastic Pattern Analysis
-
Benign vs Malignant Criteria
- Mitotic rate: <2 per 10 HPF (benign) vs >10 per 10 HPF (malignant)
- Nuclear-cytoplasmic ratio: 1:4-1:6 (normal) vs 1:1-1:2 (malignant)
- Invasion patterns: Pushing borders (benign) vs infiltrative (malignant)
- Benign: Well-circumscribed, encapsulated
- Malignant: Irregular borders, tissue invasion
- Metastatic potential: 0% (benign) vs variable (malignant)
-
Grading Systems
- Differentiation: Well (Grade 1) → Moderate (Grade 2) → Poor (Grade 3)
- Tubule formation: >75% (Grade 1) vs <10% (Grade 3)
- Nuclear pleomorphism: Minimal vs marked variation
- Grade 1: <5% high-grade nuclei
- Grade 2: 5-50% high-grade nuclei
- Grade 3: >50% high-grade nuclei
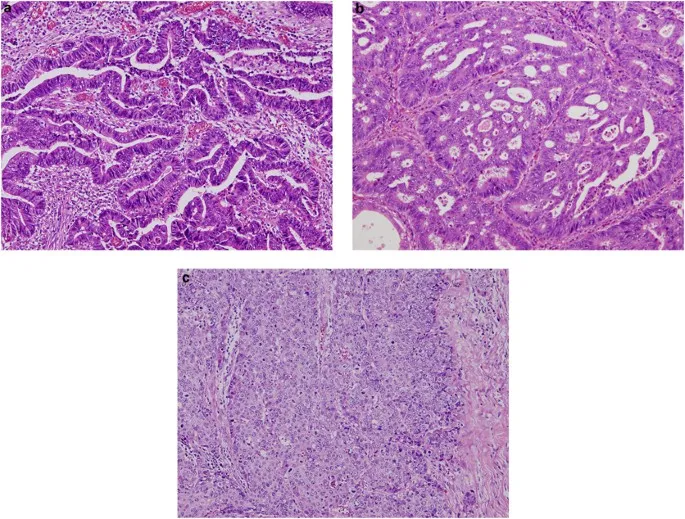
💡 Master This: The "Rule of Thirds" - Grade 1 tumors have >75% normal architecture, Grade 2 have 25-75%, and Grade 3 have <25% recognizable tissue patterns.
⭐ Clinical Pearl: Ki-67 proliferation index >20% correlates with aggressive behavior in 85% of solid tumors, regardless of histological grade.
This pattern recognition mastery transforms microscopic observations into precise diagnostic conclusions, enabling accurate disease classification and treatment planning.
🔧 Pattern Recognition Mastery: The Diagnostic Decoder


⚖️ Therapeutic Decision Algorithms: The Treatment Logic Engine
Treatment Algorithm Framework
Evidence-Based Treatment Selection Matrix
| Condition Severity | First-Line Therapy | Success Rate | Escalation Trigger | Alternative Options |
|---|---|---|---|---|
| Mild-Moderate | Conservative management | 70-85% | No improvement in 2-4 weeks | Pharmacological intervention |
| Moderate-Severe | Standard pharmacotherapy | 60-80% | <50% symptom reduction | Combination therapy |
| Severe | Intensive treatment | 40-70% | Treatment failure in 48-72hrs | Experimental protocols |
| Critical | Emergency intervention | 20-60% | Immediate deterioration | Palliative care consideration |
| Refractory | Salvage therapy | 10-40% | Multiple treatment failures | Clinical trial enrollment |
Anti-Inflammatory Treatment Algorithms
-
Acute Inflammation Management
- NSAIDs: Ibuprofen 400-800mg q6-8h (first-line)
- Corticosteroids: Prednisone 0.5-1mg/kg/day (severe cases)
- Duration limits: NSAIDs <10 days, steroids <2 weeks
- GI protection: PPI if age >65 or high-risk
- Steroid tapering: 10-25% reduction every 3-7 days
- Monitoring: CBC, CMP every 1-2 weeks on steroids
-
Chronic Inflammation Protocols
- DMARDs: Methotrexate 15-25mg weekly (rheumatoid arthritis)
- Biologics: Anti-TNF agents (refractory cases)
- Response timeline: 6-12 weeks for DMARD effect
- Methotrexate monitoring: LFTs every 4-8 weeks
- Biologic screening: TB, hepatitis B/C before initiation
- Target: <2.6 DAS28 score for remission
⭐ Clinical Pearl: Early aggressive therapy within 3-6 months of symptom onset improves long-term outcomes by 40-60% in autoimmune conditions
Antimicrobial Decision Framework
-
Empirical Therapy Selection
- Community-acquired: Amoxicillin-clavulanate or cephalexin
- Hospital-acquired: Piperacillin-tazobactam or cefepime
- ICU/severe: Vancomycin + carbapenem combination
- Duration: 7-10 days (uncomplicated) vs 14-21 days (complicated)
- De-escalation: 48-72 hours based on culture results
- Biomarker guidance: Procalcitonin <0.25 ng/mL for discontinuation
-
Resistance Pattern Adaptation
- MRSA prevalence >20%: Add vancomycin empirically
- ESBL risk factors: Use carbapenem instead of cephalosporin
- Local antibiogram: >80% sensitivity required for empirical use
- Vancomycin levels: Trough 15-20 mg/L for serious infections
- Carbapenem duration: Limit to <7 days when possible
- Combination therapy: Synergy testing for resistant organisms
💡 Master This: Antibiotic stewardship requires balancing empirical coverage (broad enough to treat likely pathogens) with resistance prevention (narrow enough to minimize ecological pressure).
⭐ Clinical Pearl: Procalcitonin-guided therapy reduces antibiotic duration by 25-30% without compromising clinical outcomes in respiratory tract infections.
These therapeutic algorithms provide systematic frameworks for translating pathological understanding into evidence-based treatment decisions across diverse clinical scenarios.
⚖️ Therapeutic Decision Algorithms: The Treatment Logic Engine


🔗 Multi-System Integration: The Pathological Network
System Integration Cascade Matrix
| Primary System | Secondary Effects | Timeline | Molecular Mediators | Clinical Manifestations |
|---|---|---|---|---|
| Cardiovascular | Renal, hepatic, pulmonary | Hours-days | ANP, BNP, aldosterone | CHF, edema, dyspnea |
| Renal | Cardiovascular, bone, hematologic | Days-weeks | EPO, PTH, phosphate | Anemia, bone disease, HTN |
| Hepatic | Coagulation, metabolic, neurologic | Hours-weeks | Albumin, clotting factors | Bleeding, encephalopathy |
| Immune | All systems | Minutes-hours | Cytokines, complement | SIRS, organ dysfunction |
| Endocrine | Metabolic, cardiovascular | Hours-months | Hormones, glucose | DM complications, atherosclerosis |
Inflammatory Network Propagation
-
Systemic Inflammatory Response (SIRS)
- Cytokine storm: IL-1β, TNF-α, IL-6 levels ↑100-1000 fold
- Complement activation: C3a, C5a trigger mast cell degranulation
- Coagulation cascade: Tissue factor expression ↑10-fold
- Endothelial dysfunction within 2-4 hours
- Capillary leak syndrome: Protein loss >200g/day
- Multi-organ dysfunction: >2 systems affected
-
Metabolic Integration
- Acute phase response: CRP ↑1000-fold, albumin ↓50%
- Insulin resistance: Glucose >180 mg/dL despite normal pancreatic function
- Protein catabolism: Negative nitrogen balance >10g/day
- Muscle wasting: 1-2% lean mass loss per day
- Wound healing impairment: Collagen synthesis ↓70%
- Immune suppression: Lymphocyte count <1000/μL
⭐ Clinical Pearl: SOFA score >2 indicates organ dysfunction, with each point increase associated with 15-20% mortality increase
Cardiovascular-Renal Integration
-
Cardiorenal Syndrome
- Type 1 (Acute): CHF → AKI within 48-72 hours
- Type 2 (Chronic): CHF → CKD over months-years
- Pathophysiology: ↓Renal perfusion + neurohormonal activation
- RAAS activation: Angiotensin II ↑300%, aldosterone ↑500%
- Sympathetic stimulation: Norepinephrine ↑200-400%
- Venous congestion: CVP >12 mmHg impairs renal venous drainage
-
Renal-Bone-Mineral Axis
- CKD progression: GFR <60 mL/min triggers PTH elevation
- Phosphate retention: >4.5 mg/dL stimulates FGF23 release
- Vitamin D deficiency: 25(OH)D <30 ng/mL in >80% of CKD patients
- Secondary hyperparathyroidism: PTH >150 pg/mL
- Bone disease: Osteitis fibrosa vs adynamic bone
- Vascular calcification: Coronary artery calcium score ↑400%
💡 Master This: The "kidney-heart axis" demonstrates how hemodynamic (forward flow), neurohormonal (RAAS), and venous congestion (backward pressure) mechanisms create bidirectional organ dysfunction.
Hepatic Integration Networks
- Hepatorenal Syndrome
- Portal hypertension: HVPG >12 mmHg triggers splanchnic vasodilation
- Effective arterial volume: ↓20-30% despite total body fluid overload
- Renal vasoconstriction: GFR decline >50% within weeks
- Vasopressin elevation: >20 pg/mL (normal <4 pg/mL)
- Norepinephrine increase: >500 pg/mL (normal <200 pg/mL)
- Survival without treatment: <2 weeks (Type 1) vs months (Type 2)
⭐ Clinical Pearl: Albumin >1.5g/kg plus vasoconstrictors improve hepatorenal syndrome survival by 40-60%, demonstrating how volume expansion plus systemic vasoconstriction can reverse functional renal failure.
This multi-system integration framework reveals how understanding cross-organ communication enables prediction and management of complex pathological cascades that define critical illness.
🔗 Multi-System Integration: The Pathological Network


🎯 Clinical Mastery Arsenal: The Pathology Command Center
Essential Diagnostic Thresholds
| Parameter | Normal Range | Mild Abnormal | Moderate Abnormal | Severe Abnormal | Critical Action |
|---|---|---|---|---|---|
| CRP | <3 mg/L | 3-10 mg/L | 10-100 mg/L | >100 mg/L | Sepsis workup |
| Troponin | <0.04 ng/mL | 0.04-0.1 ng/mL | 0.1-1.0 ng/mL | >1.0 ng/mL | STEMI protocol |
| Creatinine | 0.6-1.2 mg/dL | 1.3-1.9 mg/dL | 2.0-3.9 mg/dL | >4.0 mg/dL | Dialysis consideration |
| Bilirubin | <1.2 mg/dL | 1.3-2.5 mg/dL | 2.6-10 mg/dL | >10 mg/dL | Liver failure workup |
| Lactate | <2 mmol/L | 2-4 mmol/L | 4-8 mmol/L | >8 mmol/L | Shock protocol |
Rapid Pattern Recognition Tools
-
Inflammation Severity Scale
- Grade 1: CRP 10-30 mg/L, WBC 11-15K, ESR 30-50 mm/hr
- Grade 2: CRP 30-100 mg/L, WBC 15-25K, ESR 50-100 mm/hr
- Grade 3: CRP >100 mg/L, WBC >25K, ESR >100 mm/hr
- Grade 1: Outpatient management with oral antibiotics
- Grade 2: Hospital admission with IV antibiotics
- Grade 3: ICU consideration with broad-spectrum coverage
-
Tissue Injury Markers
- Cardiac: Troponin I >0.1 ng/mL = myocardial necrosis
- Hepatic: ALT >500 U/L = hepatocellular injury
- Renal: Creatinine ↑0.3 mg/dL in 48hrs = AKI
- Muscle: CK >1000 U/L = rhabdomyolysis risk
- Pancreatic: Lipase >3x normal = pancreatitis
⭐ Clinical Pearl: "Rule of 3s" - Troponin peaks at 3-6 hours, ALT peaks at 3 days, Creatinine peaks at 3-7 days after acute injury
Emergency Decision Matrix
- Life-Threatening Presentations
- Anaphylaxis: Epinephrine 0.3-0.5mg IM within 5 minutes
- Septic Shock: Antibiotics within 1 hour, fluids 30mL/kg
- STEMI: Door-to-balloon <90 minutes or thrombolytics <30 minutes
- Stroke: tPA within 4.5 hours, CT within 25 minutes
- DKA: Insulin 0.1 units/kg/hr, fluids 15-20mL/kg/hr
💡 Master This: Time-sensitive pathology follows the "Golden Hour" principle - early intervention within critical time windows reduces morbidity by 50-80% across most emergency conditions.
Monitoring Protocol Framework
- High-Risk Patient Surveillance
- ICU patients: Vitals q15min, labs q6-12hrs
- Post-operative: Vitals q30min x 4hrs, then q4hrs
- Chronic disease: Monthly labs, quarterly assessments
- Diabetes: HbA1c q3months, microalbumin annually
- CKD: Creatinine/GFR q3-6months, PTH q6-12months
- Heart failure: BNP q3-6months, echo annually
⭐ Clinical Pearl: Early warning scores (NEWS, MEWS) with thresholds >5 predict clinical deterioration with 85-90% sensitivity, enabling proactive intervention before organ failure.
📌 Remember: SMART monitoring - Specific parameters Measured At Regular intervals with Thresholds for action
This clinical mastery arsenal transforms pathological knowledge into practical tools for rapid assessment, accurate diagnosis, and evidence-based treatment across diverse clinical scenarios.
🎯 Clinical Mastery Arsenal: The Pathology Command Center

Unlock the full lesson and continue reading
Signup to continue reading this lesson and unlimited access questions, flashcards, AI notes, and more


Have doubts about this lesson?
Ask Rezzy, your AI Study Partner, to explain anything you didn't understand
Everything you need for USMLE prep
Get full Oncourse access with lessons, practice questions, flashcards and AI study tools.
Scan to download app