
Screening tests

On this page
🎯 The Screening Precision Matrix: Diagnostic Accuracy Mastery
Screening tests stand between populations and disease, but their power lies not in the test itself-rather in your ability to interpret sensitivity, specificity, and predictive values to make sound clinical decisions. You'll master the precision matrix that defines diagnostic accuracy, explore how prevalence reshapes what results actually mean, and build frameworks for recognizing patterns that guide testing strategies. From understanding why a positive result might still mean your patient is healthy, to integrating multi-system screening into evidence-based pathways, you'll develop the clinical reasoning that transforms raw data into confident action.
📌 Remember: SNOUT & SPIN - SNsitivity rules OUT disease (high sensitivity = few false negatives), SPecificity rules IN disease (high specificity = few false positives)
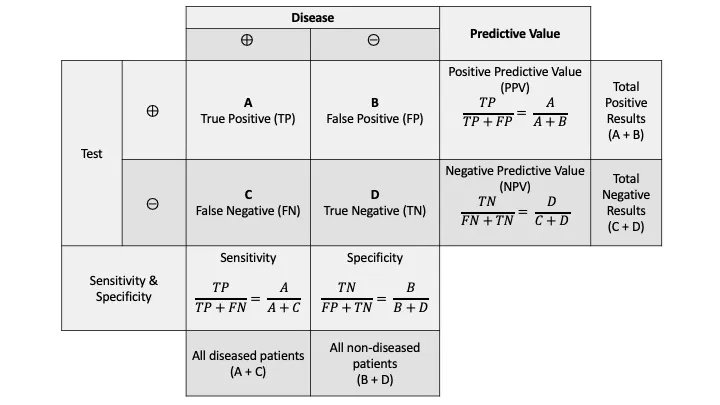
The fundamental 2×2 contingency table forms the mathematical backbone of all screening test interpretation:
| Test Result | Disease Present | Disease Absent | Total |
|---|---|---|---|
| Positive | True Positive (TP) | False Positive (FP) | TP + FP |
| Negative | False Negative (FN) | True Negative (TN) | FN + TN |
| Total | TP + FN | FP + TN | N |
- Proportion of diseased individuals correctly identified
- High sensitivity (>95%) essential for serious, treatable conditions
- Low sensitivity creates dangerous false negatives
- Specificity = TN/(TN + FP) × 100%
- Proportion of healthy individuals correctly identified
- High specificity (>95%) prevents unnecessary interventions
- Low specificity generates costly false positives
⭐ Clinical Pearl: Mammography demonstrates 85% sensitivity and 95% specificity for breast cancer detection, meaning 15% of cancers are missed (false negatives) while 5% of healthy women receive false positive results requiring additional testing.
Predictive values incorporate disease prevalence, making them clinically actionable:
-
Positive Predictive Value (PPV) = TP/(TP + FP) × 100%
- Probability that positive test indicates true disease
- Increases with higher disease prevalence
- Decreases in low-prevalence populations
-
Negative Predictive Value (NPV) = TN/(TN + FN) × 100%
- Probability that negative test excludes disease
- Decreases with higher disease prevalence
- Increases in low-prevalence populations
💡 Master This: A screening test with 99% sensitivity and 99% specificity applied to a disease with 0.1% prevalence yields only 9% PPV, meaning 91% of positive results are false positives. This mathematical reality explains why population screening requires careful cost-benefit analysis.
The likelihood ratio provides the most clinically useful measure of test performance:
-
Positive Likelihood Ratio (LR+) = Sensitivity/(1 - Specificity)
- LR+ >10: Strong evidence for disease
- LR+ 5-10: Moderate evidence for disease
- LR+ 2-5: Weak evidence for disease
-
Negative Likelihood Ratio (LR-) = (1 - Sensitivity)/Specificity
- LR- <0.1: Strong evidence against disease
- LR- 0.1-0.2: Moderate evidence against disease
- LR- 0.2-0.5: Weak evidence against disease
Understanding these mathematical relationships enables clinicians to interpret screening results with precision, balancing the benefits of early detection against the risks of overdiagnosis and unnecessary intervention. This foundation supports evidence-based screening program design and individual patient counseling.
🎯 The Screening Precision Matrix: Diagnostic Accuracy Mastery


⚙️ The Screening Engine: Operational Mechanics Unveiled
Lead Time Bias represents screening's most significant analytical challenge:
- Definition: Earlier detection creates apparent survival benefit without actual mortality reduction
- Mechanism: Screening advances diagnosis timing by 2-5 years without changing disease course
- Clinical Impact: 5-year survival appears improved despite unchanged overall mortality
- Control Method: Randomized controlled trials measuring mortality reduction, not survival rates
📌 Remember: LEAP - Lead time bias, Early detection illusion, Apparent survival benefit, Pseudo-improvement without mortality change
Length Time Bias systematically favors detection of slower-growing tumors:
- Fast-growing tumors: Rapidly progress between screening intervals (interval cancers)
- Slow-growing tumors: Detected by screening but may never cause clinical symptoms
- Overdiagnosis rate: 10-30% for breast cancer screening, 50% for prostate cancer
- Clinical consequence: Treatment of indolent disease increases morbidity without benefit
| Bias Type | Mechanism | Clinical Impact | Magnitude |
|---|---|---|---|
| Lead Time | Earlier detection timing | Apparent survival ↑ | 2-5 years |
| Length Time | Slow tumor detection | Overdiagnosis ↑ | 10-50% |
| Selection | Healthy participant bias | Efficacy overestimate | 15-25% |
| Compliance | Adherent patient outcomes | Effectiveness inflation | 20-40% |
| Verification | Positive test workup bias | Sensitivity overestimate | 5-15% |
Quality Assurance Metrics ensure screening program effectiveness:
-
Participation Rate: Target ≥70% of eligible population
- <50%: Program ineffective due to selection bias
- >80%: Optimal population coverage achieved
- Strategies: Reminder systems, mobile units, community outreach
-
Recall Rate: Percentage requiring additional testing
- Mammography: Target <10%, acceptable 5-12%
- Cervical cytology: Target <5%, acceptable 2-8%
- High recall rates: Increase anxiety, reduce compliance
-
Detection Rate: Cancer cases identified per 1,000 screens
- Initial screening: 2-3x higher than subsequent rounds
- Subsequent rounds: Reflects interval cancer rate
- Age-adjusted: Increases 2-fold per decade after age 50
Interval Cancer Analysis provides critical program evaluation:
- Definition: Cancers diagnosed between screening rounds
- Acceptable rate: <25% of expected cancer incidence
- Causes: False negative (60%), technical failure (25%), rapid growth (15%)
- Quality indicator: High interval cancer rate suggests inadequate sensitivity
💡 Master This: Effective screening programs require systematic quality monitoring with participation rates >70%, recall rates <10%, and interval cancer rates <25% of expected incidence. These metrics distinguish successful population health interventions from ineffective testing protocols.
Cost-Effectiveness Thresholds guide screening program implementation:
- Cost per Quality-Adjusted Life Year (QALY): $50,000-100,000 considered cost-effective
- Cost per Life-Year Saved: $25,000-75,000 acceptable range
- Incremental Cost-Effectiveness Ratio (ICER): Compares alternative screening strategies
- Budget Impact: Total healthcare expenditure including downstream costs
The operational mechanics of screening programs require sophisticated understanding of population dynamics, quality metrics, and economic evaluation to transform individual test performance into measurable population health benefits through systematic implementation and continuous quality improvement.
⚙️ The Screening Engine: Operational Mechanics Unveiled


🎯 Pattern Recognition Mastery: Clinical Decision Frameworks
Pre-Test Probability Assessment forms the foundation of intelligent test ordering:
-
High Pre-Test Probability (>60%):
- Positive result: Confirms clinical suspicion (PPV >90%)
- Negative result: Consider false negative, pursue diagnostic testing
- Strategy: Proceed directly to diagnostic evaluation
-
Intermediate Pre-Test Probability (20-60%):
- Optimal screening range: Maximum information gain
- Positive result: Warrants diagnostic workup (PPV 40-80%)
- Negative result: Reassuring but monitor (NPV >95%)
-
Low Pre-Test Probability (<20%):
- Positive result: Likely false positive (PPV <40%)
- Negative result: Highly reassuring (NPV >98%)
- Strategy: Consider avoiding screening due to low yield
📌 Remember: PRIOR - Pre-test probability, Risk assessment, Interpretation context, Outcome prediction, Result actionability
Risk Stratification Frameworks optimize screening intensity:
-
Average Risk Population:
- Standard screening intervals: Evidence-based guidelines
- Age-based initiation: 40-50 years for most cancers
- Cessation criteria: Life expectancy <10 years
- Quality measures: Participation >70%, recall <10%
-
High-Risk Population:
- Enhanced screening: Earlier initiation, shorter intervals
- Additional modalities: MRI + mammography for BRCA carriers
- Genetic counseling: Family history >2 relatives with cancer
- Chemoprevention: Tamoxifen for high-risk breast cancer
-
Very High-Risk Population:
- Prophylactic surgery: BRCA1/2 carriers (85% lifetime risk)
- Intensive surveillance: Every 6 months vs. annual
- Multidisciplinary care: Genetics, oncology, surgery
- Psychosocial support: Anxiety management, decision aids
| Risk Category | Screening Age | Interval | Additional Tests | Cessation |
|---|---|---|---|---|
| Average | 50 years | Annual | None | Life expectancy <10y |
| High | 40 years | Annual | MRI, genetic testing | Individualized |
| Very High | 25-30 years | 6 months | Multiple modalities | Prophylaxis consideration |
| Low | Later start | Biennial | None | Earlier cessation |
False Positive Management Protocols prevent cascade effects:
-
Immediate Response:
- Patient education: Explain 90% of abnormal screens are false positives
- Anxiety management: Provide realistic timeframes for resolution
- Efficient workup: <2 weeks to diagnostic resolution
- Clear communication: Written instructions and contact information
-
Diagnostic Workup Strategy:
- Least invasive first: Imaging before biopsy
- Targeted approach: Lesion-specific protocols
- Quality assurance: Radiologist subspecialty expertise
- Multidisciplinary: Radiology-pathology correlation
-
Long-term Follow-up:
- Return to routine: Standard intervals after negative workup
- Psychological impact: Screening compliance may decrease 20-30%
- Documentation: Clear records prevent repeated unnecessary workup
- Patient preference: Informed choice about continued screening
Shared Decision-Making Framework optimizes individual choices:
-
Information Provision:
- Quantitative benefits: Number needed to screen for 1 life saved
- Harm quantification: False positive rates and overdiagnosis risk
- Visual aids: Icon arrays showing 1,000 patient outcomes
- Time horizons: 10-year vs. lifetime risk perspectives
-
Preference Elicitation:
- Value clarification: Quality vs. quantity of life priorities
- Risk tolerance: False positive anxiety vs. missed cancer fear
- Lifestyle factors: Family history, occupation, insurance
- Decision aids: Validated tools for complex choices
💡 Master This: Effective screening requires systematic risk stratification with pre-test probability assessment, evidence-based intervals, and shared decision-making that balances individual preferences with population-based evidence to optimize outcomes while minimizing harm from false positives and overdiagnosis.
Quality Indicators for Clinical Application:
- Appropriate Use: >90% of screens meet guideline criteria
- Timely Follow-up: <14 days for abnormal results
- Patient Satisfaction: >85% would recommend screening
- Compliance Rates: >70% return for subsequent screening
- Diagnostic Yield: Cancer detection rate within expected ranges
These clinical decision frameworks transform screening from reflexive test ordering into sophisticated risk assessment and management, ensuring that population health benefits translate into optimal individual patient care through systematic, evidence-based approaches.
🎯 Pattern Recognition Mastery: Clinical Decision Frameworks


🔍 Differential Diagnosis Architecture: Systematic Discrimination Mastery
Screening Modality Performance Comparison reveals critical discriminating factors:
| Screening Test | Sensitivity | Specificity | PPV (1% prevalence) | Cost per Test | Radiation Exposure |
|---|---|---|---|---|---|
| Mammography | 85% | 95% | 14.5% | $150 | 4 mGy |
| Breast MRI | 95% | 85% | 6.1% | $1,200 | None |
| Ultrasound | 75% | 90% | 7.0% | $200 | None |
| Tomosynthesis | 90% | 92% | 10.4% | $200 | 1.5 mGy |
| Thermography | 60% | 70% | 1.9% | $300 | None |
-
Conventional Cytology (Pap smear):
- Sensitivity: 55-85% (single test)
- Specificity: 95-98%
- Interval: Annual historically, now every 3 years
- Limitations: Sampling errors, interpretation variability
-
Liquid-Based Cytology (ThinPrep):
- Sensitivity: 70-90% (15% improvement)
- Specificity: 95-98% (similar)
- Advantages: Reduced inadequate samples (<5% vs. 15%)
- Cost: 2x conventional but fewer repeats
-
HPV DNA Testing:
- Sensitivity: 95-98% for CIN2+
- Specificity: 85-90% (lower than cytology)
- Primary screening: Ages 25-65 every 5 years
- Triage role: ASC-US cytology clarification
-
HPV/Cytology Co-testing:
- Sensitivity: 98-99% (optimal)
- Specificity: 85-90%
- Interval: Every 5 years for ages 30-65
- NPV: >99.5% provides extended reassurance
📌 Remember: TECH - Technology advancement, Effectiveness improvement, Cost consideration, Harm-benefit balance
Colorectal Cancer Screening Discrimination illustrates modality selection complexity:
-
Fecal Immunochemical Test (FIT):
- Sensitivity: 75-85% for colorectal cancer
- Specificity: 95-98%
- Advantages: Non-invasive, annual, $25 cost
- Limitations: Misses adenomas, requires annual compliance
-
Colonoscopy:
- Sensitivity: 95-98% for cancer and large adenomas
- Specificity: 90-95%
- Advantages: Therapeutic capability, 10-year interval
- Limitations: Invasive, $1,000 cost, complications 0.1%
-
CT Colonography:
- Sensitivity: 85-90% for lesions >10mm
- Specificity: 85-90%
- Advantages: Non-invasive, 5-year interval
- Limitations: Radiation, extracolonic findings, $500 cost
-
Stool DNA Testing (Cologuard):
- Sensitivity: 92% for colorectal cancer, 42% for advanced adenomas
- Specificity: 87%
- Advantages: 3-year interval, detects advanced adenomas
- Limitations: $500 cost, higher false positive rate
⭐ Clinical Pearl: Colonoscopy prevents 68% of colorectal cancer deaths through adenoma removal, while FIT prevents 32% through early cancer detection. The therapeutic advantage of colonoscopy justifies higher cost and procedural risk in average-risk populations.
Age-Stratified Screening Performance reveals optimal timing windows:
-
Breast Cancer Screening by Age:
- Ages 40-49: Sensitivity 85%, PPV 3%, NNS 1,904 to prevent 1 death
- Ages 50-59: Sensitivity 85%, PPV 8%, NNS 1,339 to prevent 1 death
- Ages 60-69: Sensitivity 85%, PPV 12%, NNS 377 to prevent 1 death
- Ages 70-79: Sensitivity 85%, PPV 15%, NNS 609 to prevent 1 death
-
Cervical Cancer Screening Optimization:
- Ages 21-29: Cytology alone every 3 years
- Ages 30-65: HPV/cytology co-testing every 5 years (preferred)
- Ages >65: Discontinue if adequate prior screening
- Post-hysterectomy: Discontinue if no CIN2+ history
Population-Specific Considerations guide targeted approaches:
-
High-Risk Populations:
- BRCA carriers: MRI + mammography starting age 25
- Lynch syndrome: Colonoscopy starting age 20-25
- Immunocompromised: More frequent intervals, additional modalities
- Family history: Earlier initiation, enhanced surveillance
-
Resource-Limited Settings:
- Visual inspection with acetic acid for cervical cancer
- Clinical breast examination where mammography unavailable
- Single-visit approaches combining screening and treatment
- Cost-effectiveness prioritization over optimal sensitivity
💡 Master This: Optimal screening modality selection requires systematic comparison of sensitivity-specificity trade-offs, cost-effectiveness ratios, patient preferences, and healthcare system capacity to match testing characteristics with population needs and resource availability for maximum health benefit.
Quality Metrics for Discrimination:
- Clinical Effectiveness: Mortality reduction in randomized trials
- Operational Efficiency: Participation rates and completion rates
- Economic Value: Cost per QALY and budget impact
- Patient Experience: Satisfaction scores and preference studies
- System Integration: Workflow compatibility and infrastructure requirements
This systematic discrimination framework enables evidence-based selection of screening strategies that optimize population health outcomes through careful matching of test characteristics with clinical context, patient preferences, and healthcare system capabilities.
🔍 Differential Diagnosis Architecture: Systematic Discrimination Mastery


⚖️ Treatment Algorithm Mastery: Evidence-Based Management Pathways
Breast Cancer Screening Management demonstrates systematic risk-stratified approaches:
-
BI-RADS Category Assessment:
- BI-RADS 0: Incomplete - Additional imaging needed (<2 weeks)
- BI-RADS 1: Negative - Routine screening (annual)
- BI-RADS 2: Benign - Routine screening (annual)
- BI-RADS 3: Probably benign - 6-month follow-up (<2% malignancy risk)
- BI-RADS 4: Suspicious - Tissue sampling required (2-95% malignancy risk)
- BI-RADS 5: Highly suspicious - Urgent biopsy (>95% malignancy risk)
-
Biopsy Decision Algorithm:
- Core needle biopsy: First-line for solid masses
- Vacuum-assisted biopsy: Calcifications and MRI-detected lesions
- Surgical biopsy: Discordant imaging-pathology results
- Multidisciplinary review: Complex cases requiring radiology-pathology correlation
Cervical Cancer Screening Management illustrates precision medicine approaches:
| Cytology Result | HPV Status | Management | Follow-up Interval |
|---|---|---|---|
| Normal | Negative | Routine screening | 5 years |
| Normal | Positive | Repeat co-testing | 12 months |
| ASC-US | Negative | Routine screening | 3 years |
| ASC-US | Positive | Colposcopy | Immediate |
| LSIL | Any | Colposcopy | Immediate |
| HSIL | Any | Immediate colposcopy | <2 weeks |
- Adequate colposcopy: Entire transformation zone visualized
- Biopsy indications: Acetowhite lesions, abnormal vascular patterns
- Endocervical sampling: Required for HSIL cytology or unsatisfactory colposcopy
- Treatment thresholds: CIN2+ confirmed on biopsy
Colorectal Cancer Screening Follow-up demonstrates risk-adapted management:
-
Positive FIT Management:
- Colonoscopy within 3 months: Standard protocol
- Diagnostic yield: 5-15% cancer, 25-40% advanced adenomas
- Negative colonoscopy: Return to routine FIT screening
- Quality metrics: >90% completion rate for positive FIT
-
Colonoscopy Surveillance Intervals:
- No polyps: 10 years (routine screening)
- 1-2 small adenomas (<10mm): 5-10 years
- 3-10 adenomas or large adenoma (≥10mm): 3 years
- >10 adenomas: <3 years and genetic evaluation
- Advanced adenoma: 3 years with high-quality preparation
📌 Remember: CARE - Categorize risk level, Appropriate referral timing, Resource allocation, Evidence-based intervals
Quality Assurance in Management Pathways ensures optimal outcomes:
-
Timeliness Metrics:
- Abnormal mammography: Diagnostic resolution <14 days
- Abnormal cytology: Colposcopy <8 weeks
- Positive FIT: Colonoscopy <3 months
- Suspicious lesions: Tissue diagnosis <2 weeks
-
Communication Protocols:
- Patient notification: <5 days for abnormal results
- Provider communication: Structured reports with clear recommendations
- Tracking systems: Electronic reminders for overdue follow-up
- Patient navigation: Dedicated coordinators for complex cases
-
Multidisciplinary Coordination:
- Tumor boards: Weekly review of complex cases
- Radiology-pathology correlation: Discordant results resolution
- Genetic counseling: High-risk families and young patients
- Psychosocial support: Anxiety management and decision aids
⭐ Clinical Pearl: Patient navigation programs increase diagnostic resolution rates from 75% to 95% for abnormal screening results, reducing time to diagnosis by 50% and improving patient satisfaction scores by 30% through systematic care coordination.
Treatment Efficacy Monitoring validates management effectiveness:
-
Stage at Diagnosis:
- Screen-detected cancers: 60-80% early stage
- Interval cancers: 40-60% early stage
- Symptomatic cancers: 30-50% early stage
- Target: >70% early-stage detection for effective screening
-
Survival Outcomes:
- 5-year survival improvement: 15-30% for screen-detected vs. symptomatic
- Mortality reduction: 20-40% in screened populations
- Quality of life: Preserved through early intervention
- Cost-effectiveness: $25,000-75,000 per life-year saved
False Positive Management Strategies minimize psychological and economic harm:
-
Immediate Reassurance:
- Clear explanation: 90% of abnormal screens are false positives
- Realistic timelines: Most resolved within 2-4 weeks
- Support resources: Patient education materials and counseling
- Efficient scheduling: Minimize waiting time for diagnostic tests
-
Long-term Impact Mitigation:
- Return to routine: Standard intervals after negative workup
- Compliance monitoring: Address screening hesitancy
- Documentation: Prevent unnecessary repeat workups
- Quality improvement: Reduce false positive rates through technology upgrades
💡 Master This: Effective management of abnormal screening results requires systematic risk stratification, evidence-based referral pathways, quality-assured communication, and multidisciplinary coordination to optimize diagnostic accuracy, treatment outcomes, and patient experience while minimizing false positive harm and healthcare resource waste.
Performance Indicators for Management Quality:
- Process Measures: Timeliness, completion rates, communication quality
- Outcome Measures: Stage at diagnosis, survival rates, patient satisfaction
- Safety Measures: Complication rates, missed diagnoses, overtreatment
- Efficiency Measures: Cost per case, resource utilization, workflow optimization
These evidence-based management algorithms transform screening programs from simple test administration into comprehensive healthcare delivery systems that maximize population health benefits through systematic, quality-assured patient care pathways.
⚖️ Treatment Algorithm Mastery: Evidence-Based Management Pathways


🔗 Multi-System Integration Hub: Advanced Screening Synthesis
Genomic Risk Integration revolutionizes traditional screening approaches:
-
Polygenic Risk Scores (PRS):
- Breast cancer: 313 genetic variants explain 18% of familial risk
- Colorectal cancer: 95 variants provide 2.5-fold risk stratification
- Prostate cancer: 269 variants enable 5-fold risk discrimination
- Clinical application: Risk-stratified screening starting 5-10 years earlier for high PRS
-
Multi-Gene Panel Testing:
- Hereditary cancer syndromes: 25+ genes for comprehensive assessment
- Penetrance variability: BRCA1 (65% breast, 39% ovarian) vs. CHEK2 (28% breast)
- Management implications: Enhanced surveillance, prophylactic surgery, chemoprevention
- Cost-effectiveness: $100,000 per QALY for high-risk families
-
Pharmacogenomic Integration:
- Tamoxifen metabolism: CYP2D6 variants affect efficacy by 40%
- Aspirin response: CYP2C19 variants influence cardiovascular protection
- Statin sensitivity: SLCO1B1 variants predict myopathy risk
- Personalized prevention: Genotype-guided medication selection
Artificial Intelligence Enhancement amplifies screening precision:
-
Deep Learning Image Analysis:
- Mammography: AI sensitivity 94.5% vs. radiologist 88.0%
- Dermatology: Melanoma detection equivalent to dermatologist accuracy
- Pathology: Prostate cancer detection with 99.5% accuracy
- Retinal screening: Diabetic retinopathy detection in primary care
-
Risk Prediction Algorithms:
- Gail Model: 5-year breast cancer risk using 7 clinical factors
- Framingham Score: 10-year cardiovascular risk for statin decisions
- ASCVD Calculator: Atherosclerotic disease risk with race-ethnicity adjustment
- Machine learning: Electronic health record integration for real-time assessment
| AI Application | Sensitivity | Specificity | Clinical Impact | Implementation Status |
|---|---|---|---|---|
| Mammography CAD | 94.5% | 87.2% | 6% cancer detection ↑ | FDA approved |
| Colonoscopy polyp | 96.4% | 93.9% | 29% adenoma detection ↑ | Clinical trials |
| Cervical cytology | 91.3% | 98.1% | 50% workload reduction | Pilot programs |
| Chest CT nodules | 89.5% | 95.8% | 11% false positive ↓ | Research phase |
Multi-Modal Screening Platforms optimize detection through complementary technologies:
-
Breast Cancer Multi-Modal Approach:
- Standard risk: Mammography + clinical examination
- Intermediate risk: Mammography + ultrasound + risk assessment
- High risk: MRI + mammography + genetic counseling
- Very high risk: Enhanced surveillance + prophylaxis consideration
-
Liquid Biopsy Integration:
- Circulating tumor DNA: Multi-cancer detection with 99.3% specificity
- Protein biomarkers: CA-125 + HE4 for ovarian cancer
- MicroRNA panels: Lung cancer detection in high-risk smokers
- Methylation patterns: Colorectal cancer screening enhancement
-
Imaging Technology Convergence:
- Contrast-enhanced mammography: Combines morphology + vascularity
- PET-MRI: Metabolic + anatomic information integration
- Optical coherence tomography: Real-time tissue characterization
- Molecular imaging: Targeted contrast agents for specific biomarkers
Population Health Analytics enable precision public health:
-
Real-Time Surveillance Systems:
- Electronic health records: Automated screening reminders
- Population registries: Coverage monitoring and outcome tracking
- Geographic information systems: Access barrier identification
- Social determinants: Health equity assessment and intervention
-
Predictive Modeling for Resource Allocation:
- Demand forecasting: Screening volume prediction for capacity planning
- Risk stratification: High-risk population identification for targeted outreach
- Cost optimization: Resource allocation based on cost-effectiveness modeling
- Quality improvement: Performance metric monitoring and intervention targeting
Precision Medicine Integration personalizes screening approaches:
-
Individual Risk Assessment:
- Family history: Detailed pedigree analysis with penetrance calculations
- Environmental exposures: Occupational, lifestyle, and reproductive factors
- Comorbidity assessment: Life expectancy and competing risks
- Patient preferences: Shared decision-making with quantitative risk communication
-
Dynamic Risk Updating:
- Longitudinal monitoring: Risk factor changes over time
- Biomarker evolution: Serial measurements for trend analysis
- Screening history: Previous results inform future strategies
- Adaptive algorithms: Machine learning for personalized recommendations
⭐ Clinical Pearl: Multi-cancer early detection tests using circulating tumor DNA demonstrate 51.5% sensitivity for 12 cancer types with 99.5% specificity, potentially revolutionizing population screening by detecting multiple cancers simultaneously with minimal false positives.
Healthcare System Integration ensures seamless implementation:
-
Interoperability Standards:
- HL7 FHIR: Data exchange between electronic health systems
- DICOM: Medical imaging standardization and sharing
- SNOMED CT: Clinical terminology for consistent documentation
- ICD-11: Disease classification for epidemiologic tracking
-
Quality Assurance Networks:
- Proficiency testing: Laboratory and imaging quality monitoring
- Accreditation programs: Facility certification for screening services
- Outcome registries: Long-term follow-up for effectiveness assessment
- Continuous improvement: Performance feedback and best practice sharing
💡 Master This: Advanced screening synthesis requires seamless integration of genomic risk assessment, artificial intelligence enhancement, multi-modal imaging, and population health analytics to create personalized screening strategies that optimize individual risk-benefit ratios while maintaining population-level effectiveness and healthcare system sustainability.
Future Integration Frontiers:
- Wearable Technology: Continuous monitoring for early disease detection
- Nanotechnology: Molecular-level screening with point-of-care capability
- Quantum Computing: Complex risk modeling with unprecedented accuracy
- Blockchain: Secure data sharing for multi-institutional collaboration
This multi-system integration represents the evolution of screening from isolated testing to comprehensive health assessment platforms that leverage cutting-edge technology to deliver personalized, effective, and efficient population health interventions.
🔗 Multi-System Integration Hub: Advanced Screening Synthesis


🎯 Clinical Mastery Arsenal: Rapid-Fire Screening Expertise
Essential Screening Numbers - The Core Arsenal:
- Mammography Performance: 85% sensitivity, 95% specificity, PPV 14.5% at 1% prevalence
- Cervical Cytology: 55-85% sensitivity, HPV testing 95-98% sensitivity
- Colonoscopy: 95-98% sensitivity for cancer, 85-95% for large adenomas
- FIT Testing: 75-85% sensitivity for colorectal cancer, 95-98% specificity
- PSA Screening: 21% mortality reduction, 30% overdiagnosis rate
- Low-Dose CT: 20% lung cancer mortality reduction, 96.4% false positive rate

📌 Remember: SCREEN - Sensitivity for serious disease, Cost-effectiveness ratios, Recall rates <10%, Evidence-based intervals, Ethical considerations, Number needed to screen
Rapid Risk Stratification Framework:
-
Average Risk Criteria:
- Age-appropriate screening initiation (40-50 years most cancers)
- No family history of early-onset or multiple cancers
- No known genetic mutations
- Standard screening intervals per guidelines
-
High Risk Red Flags:
- Family history: ≥2 relatives with same cancer type
- Early onset: <50 years for breast/colorectal, <45 years for cervical
- Multiple primaries: Bilateral breast, synchronous colorectal
- Genetic syndromes: BRCA, Lynch, FAP, Cowden
-
Very High Risk Indicators:
- Known pathogenic mutations: BRCA1/2 (65-85% lifetime risk)
- Strong family history: ≥3 relatives across 2 generations
- Syndromic features: Multiple hamartomas, café-au-lait spots
- Previous high-risk lesions: Atypical hyperplasia, advanced adenomas
| Risk Level | Screening Start | Interval | Additional Tests | Special Considerations |
|---|---|---|---|---|
| Average | Guideline age | Standard | None | Shared decision-making |
| High | 5-10 years earlier | Annual | Enhanced imaging | Genetic counseling |
| Very High | 20-25 years | 6 months | Multiple modalities | Prophylaxis discussion |
⭐ Clinical Pearl: Number Needed to Screen (NNS) varies dramatically by age: mammography NNS 1,904 for ages 40-49 vs. NNS 377 for ages 60-69, explaining age-based screening recommendations and cost-effectiveness thresholds.
Quality Metrics Dashboard - Performance Indicators:
- Participation Rates: Target ≥70%, optimal ≥80%
- Recall Rates: Mammography <10%, cervical cytology <5%
- Detection Rates: Age-adjusted and round-specific benchmarks
- Interval Cancer Rates: <25% of expected incidence
- Positive Predictive Value: Varies by prevalence and test characteristics
- Timeliness: Diagnostic resolution <14 days for abnormal results
Evidence-Based Screening Intervals - Quick Reference:
-
Breast Cancer:
- Ages 40-49: Annual (controversial, shared decision)
- Ages 50-74: Biennial (USPSTF) or annual (ACS)
- Ages ≥75: Individualized based on life expectancy
-
Cervical Cancer:
- Ages 21-29: Cytology every 3 years
- Ages 30-65: HPV/cytology co-testing every 5 years (preferred)
- Ages ≥65: Discontinue if adequate prior screening
-
Colorectal Cancer:
- Ages 45-75: Colonoscopy every 10 years or FIT annually
- High risk: Colonoscopy every 5 years or earlier initiation
- Ages 76-85: Individualized decision-making
False Positive Management - Rapid Response Protocol:
-
Immediate Actions (<24 hours):
- Patient notification with clear explanation
- Reassurance: 90% of abnormal screens are false positives
- Scheduling: Diagnostic appointment <2 weeks
- Documentation: Clear communication in medical record
-
Diagnostic Workup (<2 weeks):
- Least invasive approach first
- Subspecialty expertise for complex cases
- Multidisciplinary review when indicated
- Patient navigation for care coordination
-
Resolution (<4 weeks):
- Clear communication of final results
- Return to routine screening if negative
- Enhanced surveillance if high-risk lesion
- Treatment planning if malignant
Cost-Effectiveness Thresholds - Economic Framework:
- Acceptable Cost per QALY: $50,000-100,000
- Mammography: $27,000-78,000 per QALY (age-dependent)
- Cervical screening: $8,000-13,000 per QALY
- Colonoscopy: $10,000-25,000 per QALY
- Low-dose CT: $81,000 per QALY for high-risk smokers
💡 Master This: Effective screening requires systematic risk assessment, evidence-based test selection, quality-assured implementation, and efficient management of abnormal results to achieve optimal population health outcomes while minimizing harm from false positives and overdiagnosis.
Contraindications and Cautions - Safety Framework:
-
Absolute Contraindications:
- Life expectancy <10 years for most cancer screening
- Previous adverse reactions to contrast agents
- Pregnancy for radiation-based screening
- Active treatment for same cancer type
-
Relative Contraindications:
- Significant comorbidities limiting treatment options
- Patient refusal after informed discussion
- Recent negative screening within guideline intervals
- Competing health priorities
This clinical mastery arsenal provides immediate access to essential screening knowledge, enabling rapid, evidence-based decision-making that optimizes individual patient care while supporting effective population health screening programs through systematic, quality-assured approaches.
🎯 Clinical Mastery Arsenal: Rapid-Fire Screening Expertise

Unlock the full lesson and continue reading
Signup to continue reading this lesson and unlimited access questions, flashcards, AI notes, and more


Have doubts about this lesson?
Ask Rezzy, your AI Study Partner, to explain anything you didn't understand
Everything you need for USMLE prep
Get full Oncourse access with lessons, practice questions, flashcards and AI study tools.
Scan to download app