

Group Sequential Designs - Peeking Without Penalty
- Definition: A clinical trial design allowing periodic data analysis at pre-specified points.
- Purpose: To stop a trial early for efficacy, futility, or harm, thus saving resources and protecting subjects.
- Challenge: Multiple analyses ("peeking") inflate the overall Type I error rate ($α$).
- Solution: Use pre-planned statistical stopping boundaries to adjust the significance level at each interim look.
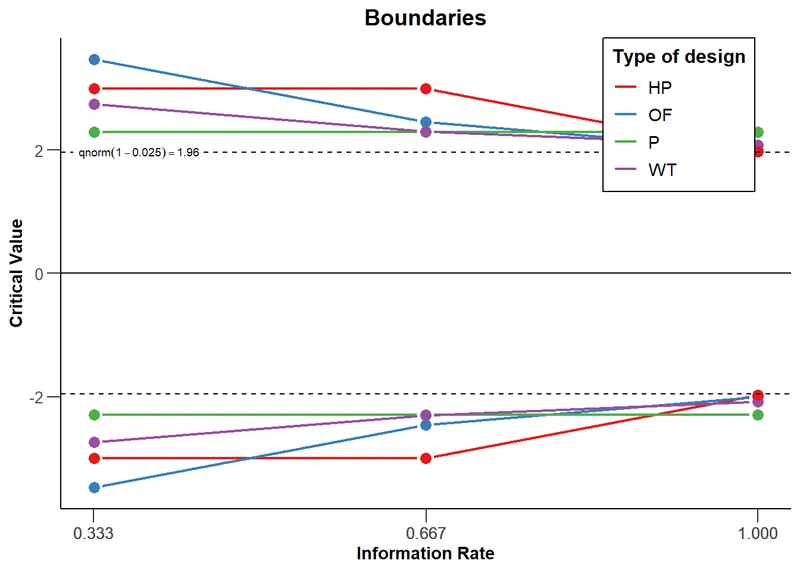
- O'Brien-Fleming: Conservative early on; requires very strong evidence to stop the trial.
- Pocock: Uses the same significance boundary for all interim analyses.
⭐ The O'Brien-Fleming method is widely used as it preserves overall statistical power and makes it difficult to stop a trial early without a very large treatment effect, reducing the risk of a premature decision.
Alpha-Spending Functions - Slicing the Error Pie
- Core Idea: A pre-defined plan for how to "spend" the total Type I error probability ($\alpha$, usually 0.05) across multiple interim analyses in a group sequential trial.
- Mechanism: At each "peek" at the data, a portion of the total $\alpha$ is used up. This prevents inflating the overall Type I error rate from repeated testing.
- Common Approaches:
- O'Brien-Fleming: Spends very little $\alpha$ early on.
- Conservative early; requires very strong evidence to stop.
- Preserves statistical power; most commonly used.
- Pocock: Spends $\alpha$ more evenly across looks.
- Easier to stop early, but loses some power compared to OBF.
- O'Brien-Fleming: Spends very little $\alpha$ early on.
⭐ Exam Favorite: The O'Brien-Fleming method is preferred because its final critical value is very close to the conventional 0.05, preserving statistical power and making results more comparable to traditional fixed-sample trials.
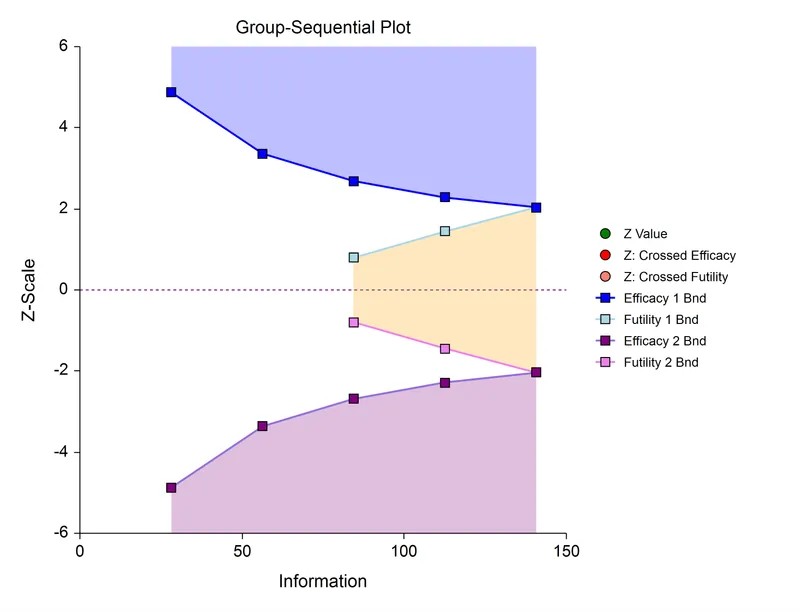
Stopping Boundaries - When to Say When
Stopping boundaries are pre-specified statistical thresholds in group sequential trials that allow for early termination for efficacy or futility. These boundaries are defined before the trial begins, based on an "alpha-spending" function.
- Efficacy Boundary: If the test statistic crosses this line at an interim analysis, the trial is stopped, and the treatment is declared effective.
- Futility Boundary: If the statistic crosses this line, it indicates the treatment is unlikely to prove effective, and the trial is stopped. This saves resources and protects participants.
- Common Methods:
- O'Brien-Fleming: Conservative early boundaries. Harder to stop early, but preserves statistical power. Most common.
- Pocock: Constant boundaries at each look. Easier to stop early, but requires a larger maximum sample size.
⭐ The O'Brien-Fleming method is favored because its conservative early boundaries minimize the risk of stopping a trial due to a random high early on, thus preserving the overall study power close to that of a traditional fixed-sample design.
Advantages & Disadvantages - The Good & The Bad
-
Advantages
- Ethical: Can stop a trial early for clear efficacy or harm, protecting patients from inferior treatments.
- Efficient: Saves time and resources if a strong conclusion is reached before the planned end.
-
Disadvantages
- Complex: Requires special statistical methods to avoid inflating Type I error from multiple analyses.
- Logistical Burden: Needs an independent Data & Safety Monitoring Board (DSMB).
⭐ Multiple analyses increase the chance of a false positive (Type I error). Interim analyses must therefore use much stricter p-value boundaries (e.g., p < 0.005) to maintain an overall trial alpha of 0.05.
High‑Yield Points - ⚡ Biggest Takeaways
- Group sequential designs allow for interim analyses of data at predetermined points during a clinical trial.
- The primary goal is to stop the trial early for overwhelming efficacy or futility, enhancing ethical standards.
- Multiple analyses inflate the overall Type I error rate (α), increasing the chance of a false-positive result.
- Alpha-spending functions are used to adjust significance boundaries at each look, preserving the overall α.
- This approach can significantly reduce trial duration and cost.
- All stopping rules and analysis plans must be pre-specified in the study protocol.
Unlock the full lesson and continue reading
Signup to continue reading this lesson and unlimited access questions, flashcards, AI notes, and more