
Number needed to treat/harm

On this page
📊 The Clinical Translation Engine: Converting Statistics to Patient Impact
Number needed to treat and number needed to harm transform abstract trial statistics into a concrete answer every clinician needs: how many patients must I treat before one benefits, and how many before one is harmed? You'll master calculating these metrics from raw data, recognize when they're misleading or misapplied, and integrate them with baseline risk and patient values to make evidence-based decisions at the bedside. This is where statistics become clinical wisdom, turning relative risks and odds ratios into the practical currency of shared decision-making.
The Foundation: What NNT and NNH Actually Measure
NNT represents the number of patients who must receive a specific treatment for one additional patient to experience the desired outcome compared to control. NNH quantifies the number of patients treated before one additional patient experiences an adverse event.
📌 Remember: TREAT - Treat Required for Extra Additional Therapeutic benefit. NNT = 1/ARR (Absolute Risk Reduction)
- NNT Calculation Framework
- Formula: NNT = 1 / |ARR| where ARR = Control Event Rate - Treatment Event Rate
- Perfect treatment: NNT = 1 (every patient benefits)
- Moderate efficacy: NNT = 5-10 (clinically meaningful)
- Marginal benefit: NNT = >50 (questionable clinical value)
- Aspirin for MI prevention: NNT = 67 over 2 years
- Statins for primary prevention: NNT = 104 over 5 years
- Antihypertensives for stroke: NNT = 128 over 2 years
⭐ Clinical Pearl: NNT values <10 typically indicate highly effective interventions, while NNT >50 suggests marginal clinical benefit requiring careful risk-benefit analysis.
NNH: The Safety Counterbalance
NNH follows identical mathematical principles but quantifies harm rather than benefit, using the absolute risk increase (ARI) of adverse events.
- NNH Calculation Structure
- Formula: NNH = 1 / |ARI| where ARI = Treatment Event Rate - Control Event Rate
- High safety: NNH = >100 (rare adverse events)
- Moderate risk: NNH = 20-50 (careful monitoring required)
- Significant concern: NNH = <10 (substantial harm risk)
- NSAIDs causing GI bleeding: NNH = 150 over 6 months
- Warfarin causing major bleeding: NNH = 250 annually
- Chemotherapy causing neutropenia: NNH = 8-12 per cycle
| Intervention | Indication | NNT | NNH | Time Frame | Clinical Significance |
|---|---|---|---|---|---|
| Aspirin | MI Prevention | 67 | 150 (GI bleed) | 2 years | Favorable profile |
| Statins | Primary Prevention | 104 | 200 (myopathy) | 5 years | Long-term benefit |
| ACE Inhibitors | Heart Failure | 8 | 45 (cough) | 1 year | Excellent efficacy |
| Antibiotics | UTI Treatment | 3 | 25 (C. diff) | 1 week | High effectiveness |
| Antipsychotics | Schizophrenia | 6 | 15 (EPS) | 6 months | Requires monitoring |
Absolute vs Relative Risk: The Clinical Context
NNT derives from absolute risk reduction (ARR), providing context that relative risk reduction (RRR) cannot deliver. A 50% RRR sounds impressive but may represent minimal absolute benefit.
- Clinical Example: Statin Therapy
- Control group: 4% cardiovascular events over 5 years
- Treatment group: 2% cardiovascular events over 5 years
- RRR: 50% (sounds dramatic)
- ARR: 2% (actual benefit)
- NNT: 50 patients (realistic expectation)
⚠️ Warning: Marketing materials often emphasize RRR while obscuring ARR. Always calculate NNT to understand true clinical impact and resource allocation requirements.
Connect these foundational concepts through practical calculation methods to master real-world clinical application patterns.
📊 The Clinical Translation Engine: Converting Statistics to Patient Impact


⚙️ The Mathematical Precision Matrix: Calculation Mastery
The Core Calculation Engine
NNT calculation follows a systematic approach that converts event rates into clinically meaningful numbers representing real patients requiring treatment.
📌 Remember: CARE - Control minus Active treatment Rate Equals ARR. Then flip it: NNT = 1/ARR for the final answer.
- Step-by-Step Calculation Protocol
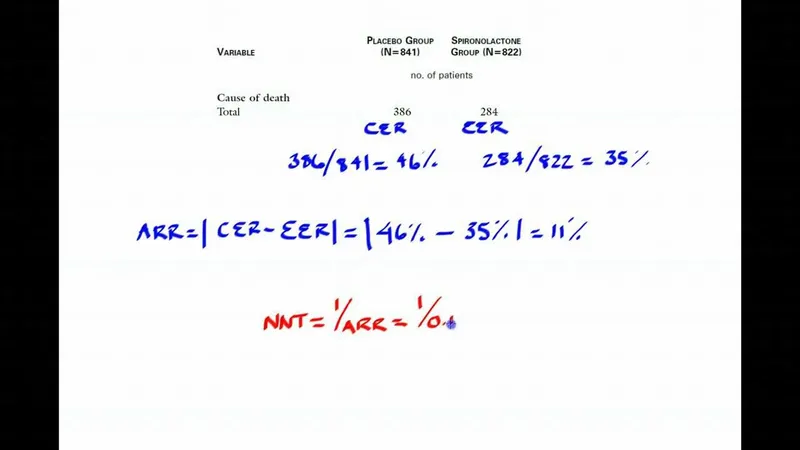
- Step 1: Identify control event rate (CER) and experimental event rate (EER)
- Step 2: Calculate ARR = CER - EER (if positive) or ARI = EER - CER (if negative)
- Step 3: Apply formula NNT = 1/ARR or NNH = 1/ARI
- Step 4: Round to nearest whole number (cannot treat partial patients)
- Example: ARR = 0.03 → NNT = 1/0.03 = 33.3 → NNT = 33
- Interpretation: Treat 33 patients for 1 additional to benefit
Precision in Different Clinical Contexts
Different medical scenarios require adjusted calculation approaches based on study design, time frames, and outcome definitions.
- Acute Treatment Scenarios
- Thrombolysis for stroke: CER = 15%, EER = 8%
- ARR: 15% - 8% = 7% = 0.07
- NNT: 1/0.07 = 14.3 → NNT = 14
- Clinical meaning: Treat 14 stroke patients for 1 additional to avoid disability
- Time sensitivity: Benefit decreases 10% per hour delay
- Selection criteria: Age <80 years, onset <4.5 hours
| Clinical Scenario | Control Rate | Treatment Rate | ARR | NNT | Clinical Context |
|---|---|---|---|---|---|
| Antibiotic for Pneumonia | 25% mortality | 5% mortality | 20% | 5 | Highly effective |
| Statin Primary Prevention | 4% events | 2% events | 2% | 50 | Long-term benefit |
| Vaccine Efficacy | 10% infection | 1% infection | 9% | 11 | Excellent prevention |
| Chemotherapy Response | 20% response | 60% response | 40% | 3 | Dramatic improvement |
| Antihypertensive Stroke | 3% stroke | 1.5% stroke | 1.5% | 67 | Marginal benefit |
Advanced Calculation Considerations
Real-world NNT calculations must account for baseline risk variations, time dependencies, and population-specific factors that modify treatment effectiveness.
- Baseline Risk Adjustment
- High-risk populations: Lower NNT (greater absolute benefit)
- Low-risk populations: Higher NNT (smaller absolute benefit)
- Example - Aspirin for MI prevention:
- High-risk patients (10% baseline): NNT = 20
- Low-risk patients (1% baseline): NNT = 200
- Same RRR (50%) but 10-fold NNT difference
💡 Master This: Identical relative risk reductions produce vastly different NNT values across risk populations. Always stratify by baseline risk to optimize treatment selection and resource allocation.
Confidence Interval Integration
NNT calculations must include confidence intervals to assess precision and statistical significance of treatment effects.
- Confidence Interval Calculation
- Formula: CI for NNT = 1/[CI limits for ARR]
- Wide CI: Imprecise estimate, larger studies needed
- Narrow CI: Reliable estimate, confident clinical application
- CI crossing infinity: Non-significant result, no treatment benefit
- Example: ARR = 2% (CI: -1% to 5%)
- NNT: 50 (CI: 20 to ∞ to -100)
- Interpretation: Uncertain benefit, avoid clinical implementation
Connect these calculation principles through pattern recognition frameworks to develop rapid clinical assessment capabilities.
⚙️ The Mathematical Precision Matrix: Calculation Mastery

🎯 The Clinical Decision Architecture: Pattern Recognition Mastery
The NNT Clinical Interpretation Matrix
Effective NNT interpretation requires systematic pattern recognition that accounts for clinical context, patient factors, and treatment alternatives.
📌 Remember: IMPACT - Identify baseline risk, Measure NNT, Patient preferences, Alternatives available, Cost considerations, Time to benefit.
- Immediate Action Patterns
- NNT 1-3: Implement immediately (life-saving interventions)
- Antibiotics for sepsis: NNT = 2-3
- Thrombolysis for STEMI: NNT = 3-4
- Insulin for DKA: NNT = 1-2
- NNT 4-10: Strong recommendation (highly effective)
- ACE inhibitors for heart failure: NNT = 6-8
- Statins for secondary prevention: NNT = 8-12
- Vaccines for high-risk populations: NNT = 5-15
- NNT 11-25: Moderate recommendation (individualize)
- Aspirin for primary prevention: NNT = 67 (high-risk) to 300 (low-risk)
- Screening mammography: NNT = 1904 (age 40-49) vs 377 (age 50-59)
- NNT 1-3: Implement immediately (life-saving interventions)
Risk Stratification Decision Framework
Clinical application requires adjusting NNT interpretation based on individual patient risk profiles and competing treatment options.
- High-Risk Patient Patterns
- Cardiovascular disease: Accept NNT up to 20-30
- Cancer treatment: Accept NNT up to 5-10
- Infectious disease: Accept NNT up to 3-5
- Preventive care: Accept NNT up to 50-100
- Diabetes patients: Statin NNT = 23 (acceptable)
- Healthy adults: Statin NNT = 104 (questionable)
- Post-MI patients: Beta-blocker NNT = 8 (excellent)
| Risk Category | Acceptable NNT Range | Clinical Examples | Decision Framework |
|---|---|---|---|
| Life-threatening | 1-5 | Sepsis, MI, Stroke | Immediate implementation |
| High morbidity | 5-15 | Heart failure, Cancer | Strong recommendation |
| Moderate risk | 15-50 | Diabetes, Hypertension | Individualized approach |
| Low risk/Prevention | 50-200 | Primary prevention | Shared decision-making |
| Very low risk | >200 | Screening in young | Generally not recommended |
Time-Dependent Pattern Recognition
NNT values change dramatically based on treatment duration and time to benefit, requiring dynamic interpretation frameworks.
- Acute vs Chronic Treatment Patterns
- Immediate benefit (hours-days): Accept higher NNT for rapid relief
- Pain medication: NNT = 3-5 over 4 hours
- Antiemetics: NNT = 4-6 over 24 hours
- Short-term benefit (weeks-months): Moderate NNT acceptable
- Antibiotics: NNT = 3-8 over 1-2 weeks
- Antidepressants: NNT = 6-8 over 6-8 weeks
- Long-term benefit (years): Higher NNT may be justified
- Statins: NNT = 50-100 over 5 years
- Antihypertensives: NNT = 67-128 over 2-5 years
- Immediate benefit (hours-days): Accept higher NNT for rapid relief
💡 Master This: Shorter time to benefit justifies higher NNT values, while long-term preventive treatments require lower NNT to justify prolonged therapy and potential adverse effects.
Competing Intervention Analysis
Clinical decision-making requires comparing NNT values across alternative treatments to optimize patient outcomes and resource utilization.
- Treatment Comparison Framework
- Direct comparison: Lower NNT indicates superior efficacy
- Safety integration: Compare NNT vs NNH ratios
- Cost-effectiveness: Factor treatment costs per NNT
- Patient preference: Consider tolerability and convenience
- Hypertension treatment options:
- ACE inhibitors: NNT = 67, NNH = 45 (cough)
- ARBs: NNT = 72, NNH = 200 (better tolerance)
- Diuretics: NNT = 56, NNH = 125 (electrolyte issues)
- Hypertension treatment options:
Connect these pattern recognition skills through systematic discrimination methods to develop advanced clinical evaluation capabilities.
🎯 The Clinical Decision Architecture: Pattern Recognition Mastery


🔬 The Evidence Evaluation Laboratory: Systematic Discrimination Mastery
The Discrimination Matrix: Beyond Simple NNT Comparison
Effective clinical discrimination requires systematic evaluation of multiple parameters beyond raw NNT values, including confidence intervals, study quality, and population applicability.
📌 Remember: VALIDATE - Verify confidence intervals, Assess study quality, Look at population, Identify time frame, Determine adverse effects, Analyze alternatives, Test applicability, Evaluate economics.
- Multi-Parameter Discrimination Framework
- Statistical precision: Narrow confidence intervals indicate reliable estimates
- Study methodology: RCT evidence superior to observational data
- Population relevance: Demographics matching clinical practice
- Time horizon: Benefit duration and sustainability
- Antidepressant comparison:
- SSRI: NNT = 6 (CI: 4-9), robust evidence
- SNRI: NNT = 7 (CI: 3-15), wider uncertainty
- TCA: NNT = 5 (CI: 3-8), more side effects
- Antidepressant comparison:
Advanced Statistical Discrimination
Clinical superiority requires analyzing confidence intervals, heterogeneity measures, and statistical significance patterns across multiple studies.
| Intervention | NNT | 95% CI | Study Quality | Population | Time Frame | Clinical Recommendation |
|---|---|---|---|---|---|---|
| Drug A | 8 | 6-12 | High (RCT n=5000) | Broad | 1 year | First-line choice |
| Drug B | 7 | 3-25 | Moderate (RCT n=500) | Limited | 6 months | Second-line option |
| Drug C | 9 | 8-11 | High (Meta-analysis) | Elderly | 2 years | Preferred in elderly |
| Drug D | 6 | 2-∞ | Low (Observational) | Young adults | 3 months | Insufficient evidence |
| Drug E | 10 | 8-13 | High (RCT n=10000) | Diabetics | 5 years | Diabetes-specific choice |
Baseline Risk Stratification Analysis
Identical NNT values may represent vastly different clinical significance depending on baseline risk populations and absolute benefit magnitudes.
- Risk-Stratified Discrimination Patterns
- High-risk populations: Small ARR still clinically meaningful
- Post-MI patients: Statin NNT = 23 represents 4.3% ARR
- Clinical significance: 43 fewer events per 1000 patients
- Low-risk populations: Same NNT may lack clinical relevance
- Healthy adults: Statin NNT = 104 represents 0.96% ARR
- Clinical significance: 10 fewer events per 1000 patients
- Cost-effectiveness threshold: $50,000 per QALY standard
- High-risk treatment: $2,000 per patient benefited
- Low-risk treatment: $15,000 per patient benefited
- High-risk populations: Small ARR still clinically meaningful
Temporal Discrimination Framework
Treatment effectiveness varies significantly across time horizons, requiring discrimination based on immediate vs long-term benefit patterns.
- Time-Dependent Effectiveness Patterns
- Immediate benefit (0-30 days): Focus on symptom relief and acute outcomes
- Analgesics for pain: NNT = 3-5 over 4-6 hours
- Antiemetics for nausea: NNT = 4-7 over 24 hours
- Bronchodilators for asthma: NNT = 2-4 over 1 hour
- Short-term benefit (1-12 months): Balance efficacy with tolerability
- Antibiotics for infection: NNT = 3-8 over 7-14 days
- Antidepressants for depression: NNT = 6-8 over 6-8 weeks
- Antihypertensives for BP control: NNT = 3-5 over 3 months
- Long-term benefit (1+ years): Emphasize sustained outcomes and safety
- Statins for cardiovascular prevention: NNT = 50-100 over 5 years
- Bisphosphonates for fracture prevention: NNT = 67 over 3 years
- Aspirin for primary prevention: NNT = 300 over 2 years
- Immediate benefit (0-30 days): Focus on symptom relief and acute outcomes
💡 Master This: Time-dependent NNT analysis reveals that short-term impressive results may not translate to sustained long-term benefits. Always evaluate treatment effectiveness across relevant clinical time horizons.
Adverse Effect Integration Analysis
Complete clinical discrimination requires balancing NNT (benefit) against NNH (harm) to determine net clinical value and safety profiles.
- Benefit-Harm Discrimination Matrix
- Favorable profile: NNT < NNH with significant margin
- ACE inhibitors: NNT = 8, NNH = 45 (cough) - 5.6:1 ratio
- Balanced profile: NNT ≈ NNH requiring careful selection
- Warfarin: NNT = 67, NNH = 250 (bleeding) - 3.7:1 ratio
- Unfavorable profile: NNT > NNH indicating potential net harm
- COX-2 inhibitors: NNT = 50, NNH = 67 (cardiovascular) - 0.75:1 ratio
- Favorable profile: NNT < NNH with significant margin
Connect these discrimination skills through treatment algorithm development to master evidence-based clinical decision-making frameworks.
🔬 The Evidence Evaluation Laboratory: Systematic Discrimination Mastery

⚖️ The Treatment Algorithm Engine: Evidence-Based Decision Mastery
The Algorithmic Decision Framework
Evidence-based treatment algorithms systematically integrate NNT effectiveness data with patient-specific factors, contraindications, and alternative options.
📌 Remember: ALGORITHM - Assess baseline risk, Look at NNT threshold, Gauge patient factors, Order by effectiveness, Review contraindications, Integrate NNH data, Time to benefit, Health economics, Monitor outcomes.
Risk-Stratified Treatment Protocols
Clinical algorithms must adjust NNT thresholds based on disease severity, patient comorbidities, and treatment urgency to optimize clinical outcomes.
- High-Risk Algorithm Pathways
- Cardiovascular disease: Accept NNT up to 25-30
- Post-MI patients: Beta-blockers NNT = 8 → Immediate implementation
- Heart failure: ACE inhibitors NNT = 6 → First-line therapy
- Atrial fibrillation: Anticoagulation NNT = 67 → Standard care
- Cancer treatment: Accept NNT up to 5-10
- Adjuvant chemotherapy: NNT = 8 → Strong recommendation
- Targeted therapy: NNT = 12 → Consider alternatives
- Immunotherapy: NNT = 6 → Preferred option
- Cardiovascular disease: Accept NNT up to 25-30
| Clinical Scenario | Risk Level | NNT Threshold | Algorithm Action | Monitoring Requirements |
|---|---|---|---|---|
| Acute MI | Very High | <15 | Immediate treatment | Continuous cardiac monitoring |
| Heart Failure | High | <25 | Standard protocol | Weekly follow-up x 4 weeks |
| Diabetes | Moderate | <50 | Individualized approach | Quarterly HbA1c monitoring |
| Hypertension | Moderate | <75 | Lifestyle + medication | Monthly BP checks x 3 months |
| Primary Prevention | Low | <100 | Shared decision-making | Annual risk reassessment |
Treatment algorithms must weight NNT evidence based on study quality, population applicability, and confidence interval precision.
- Evidence Hierarchy Integration
- Level 1: High-quality RCT with narrow CI → Direct implementation
- Thrombolysis for stroke: NNT = 14 (CI: 10-20) → Standard protocol
- Level 2: Moderate-quality evidence with wider CI → Cautious implementation
- Novel antidepressant: NNT = 8 (CI: 4-25) → Second-line option
- Level 3: Low-quality or observational data → Research needed
- Experimental therapy: NNT = 6 (CI: 2-∞) → Clinical trial only
- Level 1: High-quality RCT with narrow CI → Direct implementation
⭐ Clinical Pearl: Algorithm strength depends on evidence quality, not just NNT magnitude. High-quality evidence with NNT = 15 may warrant stronger recommendations than low-quality evidence with NNT = 5.
Cost-Effectiveness Algorithm Integration
Modern treatment algorithms must incorporate economic analysis alongside clinical effectiveness to optimize healthcare resource allocation.
- Economic Integration Framework
- Cost per NNT calculation: (Drug cost × NNT) + monitoring costs
- QALY analysis: Quality-adjusted life years gained per treatment
- Budget impact: Total population cost implications
- Statin therapy example:
- High-risk patients: $2,000 per patient benefited → Cost-effective
- Low-risk patients: $15,000 per patient benefited → Questionable value
- Algorithm decision: Risk-stratified implementation
- Statin therapy example:
Dynamic Algorithm Adjustment
Treatment algorithms require built-in mechanisms for updating based on new evidence, changing patient factors, and treatment response patterns.
- Algorithm Update Triggers
- New RCT evidence: Significant NNT changes (>20% difference)
- Safety signals: New NNH data or contraindications
- Population changes: Demographic shifts affecting baseline risk
- Cost changes: Generic availability or new pricing
- Update frequency: Annual evidence review with quarterly safety monitoring
- Implementation timeline: 6-month transition period for major changes
💡 Master This: Effective treatment algorithms balance evidence strength, patient factors, economic considerations, and practical implementation constraints. Regular updates ensure continued optimization of patient outcomes.
Connect these algorithmic frameworks through multi-system integration to develop comprehensive clinical mastery tools.
⚖️ The Treatment Algorithm Engine: Evidence-Based Decision Mastery


🌐 The Clinical Integration Nexus: Multi-System Evidence Synthesis
The Integration Architecture: Cross-Specialty Evidence Synthesis
Advanced clinical practice requires synthesizing NNT evidence across cardiovascular, endocrine, neurological, and other systems to create comprehensive treatment strategies.
📌 Remember: SYNTHESIS - System interactions, Yield optimization, Network effects, Timing coordination, Holistic outcomes, Evidence integration, Safety profiles, Interventional synergy, Sustained benefits.
- Cardiovascular-Metabolic Integration
- Diabetes + CAD management: Synergistic NNT benefits
- Metformin: NNT = 15 for cardiovascular outcomes in diabetics
- SGLT2 inhibitors: NNT = 67 for heart failure prevention
- Combined therapy: Additive benefits with NNT = 8-12 for composite outcomes
- Hypertension + diabetes: Multiplicative risk reduction
- ACE inhibitors: NNT = 67 for stroke prevention alone
- In diabetics: NNT = 25 for same outcome (enhanced effectiveness)
- Renal protection: Additional NNT = 45 for nephropathy prevention
- Diabetes + CAD management: Synergistic NNT benefits
Cutting-Edge Integration Insights
Recent research reveals unexpected NNT synergies when treatments target multiple pathophysiological pathways simultaneously.
- Inflammatory Pathway Integration
- Anti-inflammatory effects: Multiple medications show pleiotropic benefits
- Statins: Primary NNT = 50 for cardiovascular events
- Secondary benefit: NNT = 125 for stroke prevention via inflammation
- Tertiary benefit: NNT = 200 for dementia risk reduction
- Polypill strategies: Combining low-dose medications
- Individual NNT values: Aspirin (67), Statin (50), ACE inhibitor (75)
- Combined polypill: NNT = 25 for cardiovascular events
- Adherence benefit: 40% improvement in medication compliance
- Anti-inflammatory effects: Multiple medications show pleiotropic benefits
| System Integration | Primary NNT | Secondary Benefits | Synergistic NNT | Clinical Significance |
|---|---|---|---|---|
| Cardio-Metabolic | 15 | Renal protection | 8 | Enhanced diabetes care |
| Neuro-Vascular | 25 | Cognitive preservation | 12 | Stroke prevention plus |
| Immuno-Inflammatory | 50 | Multi-organ protection | 20 | Systemic benefits |
| Onco-Metabolic | 8 | Reduced recurrence | 5 | Comprehensive cancer care |
| Pulmonary-Cardiac | 20 | Exercise tolerance | 10 | COPD-CHF overlap |
Personalized medicine reveals how genetic factors modify NNT values across different patient populations and medication responses.
- Genetic Modifier Patterns
- CYP2D6 polymorphisms: Affect antidepressant NNT
- Extensive metabolizers: Standard NNT = 6-8
- Poor metabolizers: Modified NNT = 12-15 (reduced efficacy)
- Ultra-rapid metabolizers: Enhanced NNT = 3-5 (increased effectiveness)
- APOE genotype: Modifies statin effectiveness
- APOE4 carriers: Enhanced NNT = 35 vs standard 50
- Mechanism: Increased inflammatory response to lipid lowering
- Clinical application: Genetic testing guides treatment intensity
- CYP2D6 polymorphisms: Affect antidepressant NNT
⭐ Clinical Pearl: Pharmacogenomic testing can improve NNT values by 20-40% through personalized medication selection and dosing optimization, particularly in psychiatry and cardiology.
Temporal Integration Frameworks
Multi-system integration requires coordinating different treatment timelines and benefit emergence patterns across medical specialties.
- Coordinated Timeline Integration
- Phase 1 (0-3 months): Acute symptom management
- Pain control: NNT = 3-5 for immediate relief
- Blood pressure: NNT = 4-6 for target achievement
- Glucose control: NNT = 8-12 for HbA1c reduction
- Phase 2 (3-12 months): Functional optimization
- Exercise tolerance: NNT = 12-18 for meaningful improvement
- Quality of life: NNT = 15-25 for patient-reported outcomes
- Biomarker normalization: NNT = 20-30 for sustained targets
- Phase 3 (1+ years): Outcome prevention
- Cardiovascular events: NNT = 50-100 for primary prevention
- Cancer recurrence: NNT = 25-50 for adjuvant therapy
- Cognitive decline: NNT = 100-200 for dementia prevention
- Phase 1 (0-3 months): Acute symptom management
💡 Master This: Successful multi-system integration requires orchestrating treatments with different NNT profiles and temporal patterns to achieve synergistic benefits that exceed individual intervention effectiveness.
Emerging Integration Technologies
Artificial intelligence and machine learning platforms increasingly integrate multiple NNT datasets to predict optimal treatment combinations for individual patients.
- AI-Enhanced Integration
- Predictive modeling: Combines 50+ variables to estimate personalized NNT
- Real-time adjustment: Updates recommendations based on treatment response
- Population insights: Identifies novel synergistic combinations
- Example platform: Integrates genomics, biomarkers, comorbidities
- Output: Personalized NNT predictions with 85% accuracy
- Clinical impact: 30% improvement in treatment selection
Connect these integration concepts through rapid mastery frameworks to develop comprehensive clinical expertise tools.
🌐 The Clinical Integration Nexus: Multi-System Evidence Synthesis


🎯 The Clinical Mastery Arsenal: Rapid Decision Tools
The Essential NNT Arsenal: Critical Numbers for Clinical Practice
Master clinicians maintain mental databases of key NNT values that enable rapid clinical decision-making without extensive calculation.
📌 Remember: ARSENAL - Acute interventions (NNT 1-5), Routine treatments (NNT 5-15), Screening programs (NNT 50-200), Emergency protocols (NNT 1-3), Novel therapies (verify CI), Adjuvant treatments (NNT 8-25), Lifestyle interventions (NNT 10-50).
- Life-Saving Interventions (Implement Immediately)
- Thrombolysis for STEMI: NNT = 3 (door-to-needle <30 minutes)
- Antibiotics for sepsis: NNT = 2 (within 1 hour of recognition)
- Insulin for DKA: NNT = 1 (immediate glucose control)
- Epinephrine for anaphylaxis: NNT = 1 (first-line treatment)
- Clinical pearl: NNT <5 with immediate benefit = no hesitation protocols
Rapid Pattern Recognition Matrix
Clinical mastery requires instant recognition of NNT patterns that guide treatment selection without detailed analysis.
| NNT Range | Clinical Interpretation | Action Required | Time to Decision |
|---|---|---|---|
| 1-3 | Life-saving/Essential | Immediate implementation | <30 seconds |
| 4-8 | Highly effective | Strong recommendation | 1-2 minutes |
| 9-15 | Good effectiveness | Standard recommendation | 2-5 minutes |
| 16-30 | Moderate benefit | Individualized decision | 5-10 minutes |
| 31-50 | Marginal benefit | Careful consideration | 10-15 minutes |
| >50 | Questionable value | Shared decision-making | Extended discussion |
Emergency Decision Protocols
Critical care situations demand instant NNT interpretation without time for detailed evidence review or complex calculations.
- Emergency NNT Thresholds
- Cardiac arrest: CPR NNT = 15 (continue until ROSC or 20 minutes)
- Stroke thrombolysis: NNT = 14 (within 4.5-hour window)
- Severe asthma: Corticosteroids NNT = 8 (prevent intubation)
- Anaphylaxis: Epinephrine NNT = 1 (repeat every 5-15 minutes)
- Decision rule: Emergency NNT >20 = reconsider intervention
Cost-Effectiveness Quick Reference
Rapid clinical decisions must integrate economic considerations with NNT effectiveness to optimize healthcare resource utilization.
- Economic Decision Framework
- High-value care: NNT <10 with cost <$10,000 per patient benefited
- Standard care: NNT 10-25 with cost <$25,000 per patient benefited
- Marginal care: NNT 25-50 with cost <$50,000 per patient benefited
- Low-value care: NNT >50 with cost >$50,000 per patient benefited
- Generic medications: Often shift treatments into higher-value categories
- Biosimilars: Reduce costs while maintaining NNT effectiveness
Patient Communication Tools
Effective NNT communication transforms complex statistics into understandable patient education that supports informed decision-making.
- Patient-Friendly NNT Translation
- Visual aids: "Out of 100 people like you, X will benefit from this treatment"
- Natural frequencies: "1 in Y patients will experience improvement"
- Time frames: "Over Z years of treatment, you have X% chance of benefit"
- Example: "Out of 100 people with your condition taking this medication for 5 years, 2 additional people will avoid a heart attack compared to no treatment"
💡 Master This: The most sophisticated NNT analysis becomes clinically worthless without effective patient communication that enables informed consent and shared decision-making.
Continuous Mastery Development
Clinical expertise requires systematic updating of NNT knowledge as new evidence emerges and practice patterns evolve.
- Mastery Maintenance Protocol
- Monthly updates: Review 3-5 new NNT studies in your specialty
- Quarterly assessment: Update personal NNT reference database
- Annual calibration: Compare personal estimates with published meta-analyses
- Peer discussion: Regular case-based NNT interpretation practice
- Target accuracy: ±20% of published NNT values for common conditions
- Decision speed: <60 seconds for routine NNT interpretation
Understanding NNT/NNH fundamentals provides the foundation for evidence-based clinical practice that optimizes patient outcomes while minimizing harm through systematic, quantitative decision-making frameworks.
🎯 The Clinical Mastery Arsenal: Rapid Decision Tools


Unlock the full lesson and continue reading
Signup to continue reading this lesson and unlimited access questions, flashcards, AI notes, and more


Have doubts about this lesson?
Ask Rezzy, your AI Study Partner, to explain anything you didn't understand
Everything you need for USMLE prep
Get full Oncourse access with lessons, practice questions, flashcards and AI study tools.
Scan to download app