
Metabolic Integration

On this page
🔄 Metabolic Integration: The Body's Master Control System
Your body orchestrates thousands of simultaneous biochemical reactions across different organs, each with specialized roles yet all working toward shared metabolic goals. This lesson reveals how organs communicate through substrates and hormones to maintain energy balance, how substrate cycling fine-tunes metabolic flux, and what happens when this integration breaks down in diabetes, metabolic syndrome, and other diseases. You'll learn to think beyond isolated pathways and recognize the dynamic, organ-specific networks that define metabolic health, then apply this systems-level understanding to interpret clinical presentations and guide therapeutic decisions that restore metabolic harmony.

Understanding metabolic integration transforms isolated biochemical knowledge into a unified framework for clinical decision-making. Every endocrine disorder, nutritional deficiency, and metabolic disease reflects disruption of this master control system.
📌 Remember: FILM - Fed state (anabolic), Intermediate fasting (glycogenolysis), Long fasting (gluconeogenesis), Metabolic stress (mixed pathways). Each state has distinct hormonal profiles and substrate utilization patterns lasting 2-4 hours, 8-12 hours, 24+ hours, and variable duration respectively.
The metabolic integration system operates through three primary control mechanisms: hormonal signaling (insulin/glucagon ratio varying 10-fold between fed and fasted states), substrate availability (blood glucose fluctuating between 70-140 mg/dL physiologically), and allosteric regulation (enzyme activity changing 100-1000 fold within minutes).
- Hormonal Control Network
- Insulin dominance: Fed state (2-4 hours post-meal)
- Promotes glycogen synthesis (150-400g liver storage)
- Activates lipogenesis (20-30% of excess carbohydrates)
- Glucagon dominance: Early fasting (8-12 hours)
- Stimulates glycogenolysis (80% of glucose production)
- Initiates gluconeogenesis (20% contribution initially)
- Cortisol/catecholamine surge: Stress response
- Increases glucose production 3-5 fold
- Mobilizes free fatty acids 10-15 fold
- Insulin dominance: Fed state (2-4 hours post-meal)
⭐ Clinical Pearl: The insulin-to-glucagon molar ratio drops from 2.3 in fed state to 0.4 in fasting state. Ratios below 0.3 indicate severe metabolic stress requiring immediate intervention, while ratios above 3.0 suggest hyperinsulinemic states predisposing to metabolic syndrome.
| Metabolic State | Duration | Primary Hormone | Glucose Source | Fat Utilization | Protein Catabolism |
|---|---|---|---|---|---|
| Fed | 0-4 hours | Insulin (↑↑) | Dietary absorption | Minimal (5-10%) | Suppressed |
| Early Fast | 4-12 hours | Glucagon (↑) | Glycogenolysis (80%) | Moderate (30-40%) | Minimal |
| Prolonged Fast | 12-72 hours | Cortisol + Glucagon | Gluconeogenesis (60%) | High (60-70%) | Moderate |
| Starvation | >72 hours | Multiple stress hormones | Gluconeogenesis (40%) | Maximal (80-85%) | Significant |
| Exercise | Variable | Catecholamines | Mixed sources | High (50-90%) | Exercise-dependent |
The substrate utilization hierarchy follows predictable patterns: glucose utilization peaks at 4-6 mg/kg/min during fed state, drops to 2-3 mg/kg/min during fasting, while fat oxidation increases from 1-2 mg/kg/min to 3-5 mg/kg/min. Brain glucose consumption remains constant at 120-130g/day except during prolonged starvation when ketone utilization can supply 60-70% of brain energy needs.
Connect these foundational metabolic states through organ-specific adaptations to understand how tissues coordinate energy production and utilization.
🔄 Metabolic Integration: The Body's Master Control System


⚙️ Organ-Specific Metabolic Machinery: Specialized Energy Factories
Organ-specific metabolic specialization enables efficient energy distribution and waste management across physiological states. Each tissue's metabolic profile reflects its functional demands and determines its vulnerability to metabolic diseases.
📌 Remember: LAMB organs for metabolic specialization - Liver (metabolic hub), Adipose (energy storage), Muscle (glucose disposal), Brain (glucose dependent). Liver processes 25% of cardiac output, adipose stores 80-85% of body energy, muscle consumes 75% of insulin-stimulated glucose, brain uses 20% of total energy despite 2% body weight.
- Liver: The Metabolic Command Center
- Glucose homeostasis: Produces 150-200g glucose/day during fasting
- Glycogenolysis capacity: 100-120g over 12-16 hours
- Gluconeogenesis rate: 6-8 mg/kg/min during prolonged fasting
- Lipid processing: Synthesizes 1-2g cholesterol/day, packages 20-30g triglycerides/day
- VLDL production: 10-15 particles/hepatocyte/hour
- Ketone production: 100-150g/day during starvation
- Protein metabolism: Synthesizes 90% of plasma proteins
- Albumin production: 10-15g/day with 20-day half-life
- Urea cycle: Processes 85% of amino acid nitrogen
- Glucose homeostasis: Produces 150-200g glucose/day during fasting
⭐ Clinical Pearl: Liver metabolic reserve is enormous - 75-80% of hepatic mass can be lost before metabolic failure occurs. However, specific functions fail sequentially: albumin synthesis decreases when functional mass drops below 60%, glucose homeostasis fails below 40%, and coagulation factor synthesis ceases below 20%.
- Skeletal Muscle: The Glucose Disposal Unit
- Insulin sensitivity: 75-80% of insulin-stimulated glucose disposal
- GLUT4 translocation increases glucose uptake 10-20 fold
- Glycogen storage capacity: 300-500g in trained individuals
- Substrate flexibility: Can switch between glucose and fat oxidation
- Respiratory quotient ranges from 0.7 (pure fat) to 1.0 (pure glucose)
- Lactate production: 1-2 mmol/L at rest, 15-25 mmol/L during intense exercise
- Protein turnover: 1-2% of muscle protein renewed daily
- Muscle protein synthesis: 1.2-1.6%/day in healthy adults
- Breakdown accelerates 2-3 fold during catabolic states
- Insulin sensitivity: 75-80% of insulin-stimulated glucose disposal
💡 Master This: Muscle insulin resistance precedes systemic insulin resistance by 3-5 years. Early markers include decreased GLUT4 expression (30-40% reduction), impaired glycogen synthesis (50% decrease), and increased intramyocellular lipid accumulation (2-3 fold increase). These changes occur before fasting glucose or HbA1c abnormalities.
| Organ | Primary Fuel (Fed) | Primary Fuel (Fasted) | Storage Capacity | Metabolic Rate | Clinical Significance |
|---|---|---|---|---|---|
| Brain | Glucose (100%) | Glucose (70%) + Ketones (30%) | Minimal glycogen | 20% of BMR | Glucose-dependent, ketone-adaptable |
| Liver | Mixed substrates | Fat (60%) + Amino acids (40%) | 100-120g glycogen | 25% of BMR | Metabolic hub, glucose producer |
| Muscle | Glucose (70%) + Fat (30%) | Fat (80%) + Glucose (20%) | 300-500g glycogen | 25-30% of BMR | Insulin-sensitive, glucose disposal |
| Adipose | Glucose for lipogenesis | Stored triglycerides | 10-30kg triglycerides | 5% of BMR | Energy reservoir, endocrine organ |
| Heart | Fat (60%) + Glucose (40%) | Fat (90%) + Ketones (10%) | Minimal glycogen | 10% of BMR | Metabolically flexible, high demand |
- Energy storage: 135,000 kcal in 15kg adipose tissue vs 1,600 kcal in 400g glycogen
- Lipolysis rate: 2-3 μmol/kg fat/min during fasting
- Lipogenesis: 20-30% of excess carbohydrates converted to fat
- Endocrine function: Secretes 50+ adipokines affecting metabolism
- Leptin levels: 10-15 ng/mL per 10kg fat mass
- Adiponectin: 5-10 μg/mL (inversely related to fat mass)

⭐ Clinical Pearl: Visceral adipose tissue is 3-5 times more metabolically active than subcutaneous fat. Waist-to-hip ratio above 0.9 (men) or 0.85 (women) indicates visceral adiposity and 2-3 fold increased cardiovascular risk, independent of BMI.
The brain's metabolic inflexibility during fed states contrasts sharply with its remarkable adaptation during starvation, when ketone utilization can increase 10-15 fold to supply 60-70% of energy needs. This metabolic switch occurs over 3-5 days and involves upregulation of ketone transporters and enzymes.
Connect organ-specific metabolic machinery through substrate cycling and inter-organ communication to understand systemic metabolic coordination.
⚙️ Organ-Specific Metabolic Machinery: Specialized Energy Factories


🔄 Substrate Cycling: The Metabolic Traffic Control System
Substrate cycling represents the sophisticated metabolic traffic control that allows rapid metabolic adjustments without waiting for transcriptional changes. These "futile cycles" consume 2-5% of total energy expenditure but provide 10-100 fold faster metabolic control than enzyme synthesis.
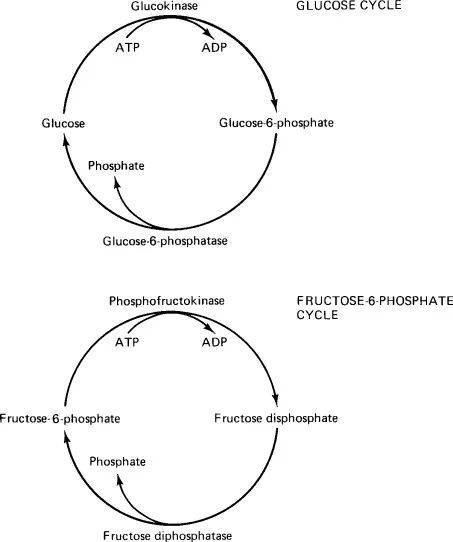
📌 Remember: FAST substrate cycles - Fructose-6-phosphate/Fructose-1,6-bisphosphate (glycolysis control), Acetyl-CoA/Malonyl-CoA (fatty acid synthesis control), Succinate/Fumarate (TCA cycle control), Triglyceride/Fatty acid (lipolysis control). Each cycle consumes 1 ATP per turn but enables instantaneous flux control vs hours for transcriptional regulation.
- Glucose-Fatty Acid Cycle (Randle Cycle)
- Reciprocal inhibition: High glucose inhibits fat oxidation, high fat inhibits glucose oxidation
- Acetyl-CoA from fat oxidation inhibits pyruvate dehydrogenase (90% inhibition)
- Citrate from fat oxidation inhibits phosphofructokinase (70% inhibition)
- Metabolic flexibility index: Ability to switch between substrates
- Healthy individuals: RQ changes from 0.7 to 1.0 within 30 minutes
- Insulin resistant: RQ changes 50% slower, incomplete switching
- Clinical significance: Disrupted in diabetes and metabolic syndrome
- Type 2 diabetes: 40-60% reduction in glucose oxidation flexibility
- Metabolic syndrome: 30-50% impaired fat oxidation capacity
- Reciprocal inhibition: High glucose inhibits fat oxidation, high fat inhibits glucose oxidation
⭐ Clinical Pearl: The respiratory quotient (RQ) reflects substrate utilization: 0.7 indicates pure fat oxidation, 1.0 pure glucose oxidation. Fasting RQ above 0.85 suggests metabolic inflexibility and predicts insulin resistance development within 2-3 years with 80% accuracy.
- Triglyceride-Fatty Acid Cycling
- Continuous lipolysis-reesterification: 25-30% of released fatty acids re-esterified
- Net lipolysis rate: 2-3 μmol/kg/min during fasting
- Cycling rate: 8-12 μmol/kg/min (total turnover)
- Energy cost: 15-20% of lipolytic energy consumed in cycling
- Thermogenic benefit: 2-3% of total energy expenditure
- Hormonal sensitivity: 10-fold faster response than net lipolysis
- Pathological states: Increased cycling in obesity and diabetes
- Obesity: 50-100% increased cycling rate
- Type 2 diabetes: 200-300% increased hepatic cycling
- Continuous lipolysis-reesterification: 25-30% of released fatty acids re-esterified
💡 Master This: Substrate cycling provides metabolic amplification - small hormonal changes produce large flux changes. 10% increase in insulin can decrease net lipolysis by 50% through cycling effects. This amplification explains why subtle hormonal imbalances cause dramatic metabolic consequences in diabetes and obesity.
| Substrate Cycle | Location | Energy Cost (ATP/cycle) | Response Time | Flux Control | Clinical Relevance |
|---|---|---|---|---|---|
| Glucose-G6P | Liver, muscle | 1 ATP | Seconds | 5-10 fold | Glucose homeostasis |
| F6P-F1,6BP | All tissues | 1 ATP | Seconds | 10-50 fold | Glycolytic control |
| TG-FA | Adipose tissue | 1 ATP | Minutes | 3-5 fold | Lipolytic control |
| Protein synthesis-breakdown | Muscle | 4 ATP/amino acid | Hours | 2-3 fold | Muscle wasting |
| Cholesterol synthesis-breakdown | Liver | 3 ATP | Hours | 5-10 fold | Lipid homeostasis |
- Continuous protein turnover: 300-400g protein/day synthesized and degraded
- Muscle protein synthesis: 1.2-1.6%/day in healthy adults
- Protein breakdown: 1.0-1.4%/day (net balance +0.2%/day)
- Energy cost: 20-25% of protein synthesis energy for turnover
- 4 ATP per peptide bond formation
- 1 GTP per amino acid activation
- Metabolic regulation: Responds to feeding, exercise, hormones
- Insulin increases synthesis 50-100%, decreases breakdown 30-50%
- Leucine threshold: 2.5-3.0g needed to stimulate muscle protein synthesis
⭐ Clinical Pearl: Protein turnover rate predicts metabolic health. High turnover (>1.8%/day) with positive balance indicates anabolic health, while low turnover (<1.0%/day) suggests metabolic dysfunction. Sarcopenia begins when protein breakdown exceeds synthesis by >0.5%/day consistently.
The metabolic cost of substrate cycling appears wasteful but provides essential metabolic control. Total cycling consumes 5-8% of resting energy expenditure but enables second-to-minute metabolic adjustments that would otherwise require hours through transcriptional mechanisms.
Connect substrate cycling precision through hormonal integration to understand how endocrine signals coordinate metabolic traffic across tissues.
🔄 Substrate Cycling: The Metabolic Traffic Control System


🎛️ Hormonal Integration: The Metabolic Command Network
📌 Remember: ITCH for major metabolic hormones - Insulin (anabolic master), Thyroid (metabolic rate), Cortisol (stress adaptation), Hormone-sensitive lipase activators (glucagon, catecholamines). Insulin acts within minutes, thyroid over days-weeks, cortisol over hours-days, and catecholamines within seconds.
- Insulin: The Anabolic Orchestrator
- Concentration dynamics: 5-15 μU/mL fasting, 50-100 μU/mL post-meal peaks
- Half-life: 4-6 minutes in circulation
- Tissue binding: 90% cleared in first hepatic pass
- Receptor signaling: Tyrosine kinase cascade affecting 100+ downstream targets
- IRS-1 phosphorylation: 10-fold increase within 2 minutes
- GLUT4 translocation: 5-20 fold glucose uptake increase
- Metabolic effects: Coordinated anabolic promotion across tissues
- Glycogen synthesis: 3-5 fold increase in liver and muscle
- Lipogenesis: 10-20 fold increase in adipose tissue
- Protein synthesis: 50-100% increase in muscle
- Concentration dynamics: 5-15 μU/mL fasting, 50-100 μU/mL post-meal peaks
⭐ Clinical Pearl: Insulin sensitivity index (glucose disposal rate per insulin unit) normally >6 mg/kg/min per μU/mL. Values below 4 indicate insulin resistance, below 2 suggest severe resistance requiring intervention. This index predicts diabetes development 5-7 years before glucose abnormalities appear.
- Counter-regulatory Hormone Network
- Glucagon: Primary glucose mobilization hormone
- Concentration: 50-100 pg/mL fasting, 200-300 pg/mL during hypoglycemia
- Hepatic effects: 3-5 fold increase in glucose production within 15 minutes
- Lipolytic effects: 2-3 fold increase in fatty acid release
- Cortisol: Stress adaptation and gluconeogenesis
- Circadian rhythm: 15-25 μg/dL morning, 5-10 μg/dL evening
- Stress response: 50-100 μg/dL during severe stress
- Metabolic effects: 2-4 fold increase in gluconeogenesis over 2-4 hours
- Catecholamines: Rapid metabolic mobilization
- Epinephrine: <50 pg/mL rest, 500-2000 pg/mL during stress
- Metabolic effects: 5-10 fold increase in lipolysis within minutes
- Glucagon: Primary glucose mobilization hormone
💡 Master This: Hormonal ratios determine metabolic state more than absolute concentrations. Insulin:glucagon molar ratio >2.0 promotes anabolism, <0.5 promotes catabolism. Cortisol:insulin ratio >1.0 indicates catabolic stress. These ratios predict metabolic outcomes with 85-90% accuracy.
| Hormone | Onset | Peak Effect | Duration | Primary Target | Metabolic Action | Clinical Threshold |
|---|---|---|---|---|---|---|
| Insulin | 2-5 min | 30-60 min | 2-4 hours | Muscle, liver, adipose | Anabolic promotion | >25 μU/mL (resistance) |
| Glucagon | 5-10 min | 15-30 min | 1-2 hours | Liver | Glucose production | >150 pg/mL (stress) |
| Cortisol | 30-60 min | 2-4 hours | 6-12 hours | Multiple tissues | Gluconeogenesis | >30 μg/dL (excess) |
| Epinephrine | 30 sec | 2-5 min | 10-30 min | Multiple tissues | Rapid mobilization | >200 pg/mL (stress) |
| Thyroid (T3) | 6-12 hours | 2-3 days | 1-2 weeks | All tissues | Metabolic rate | <2.3 pg/mL (deficiency) |
- Concentration hierarchy: T4 (100-fold higher) → T3 (active form)
- T4: 4.5-12 μg/dL, T3: 80-200 ng/dL
- Tissue conversion: 80% of T3 from peripheral T4 conversion
- Metabolic rate control: 15-30% of basal metabolic rate regulation
- Hyperthyroidism: 20-50% increase in metabolic rate
- Hypothyroidism: 15-30% decrease in metabolic rate
- Substrate utilization effects: Enhances both glucose and fat oxidation
- Glucose turnover: 30-50% increase in hyperthyroidism
- Lipolysis: 2-3 fold increase with thyroid excess
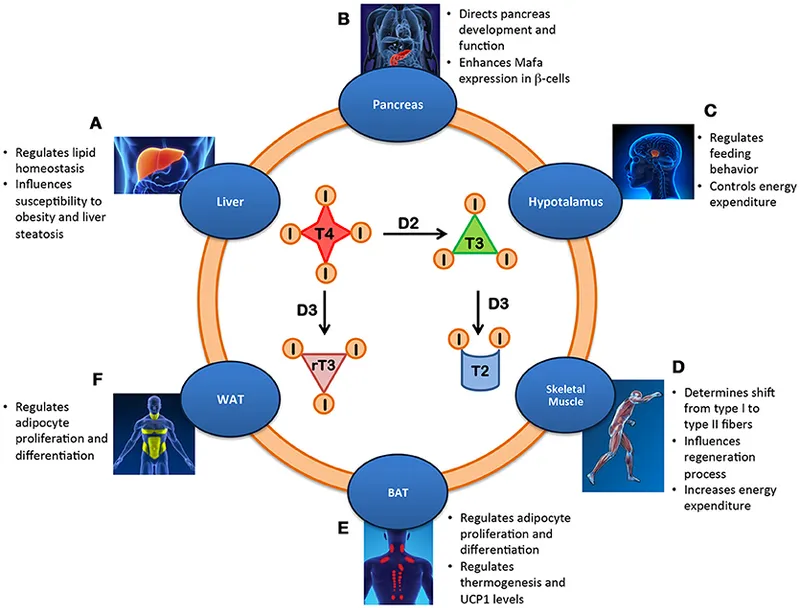
⭐ Clinical Pearl: Free T3:reverse T3 ratio reflects tissue thyroid status better than TSH. Normal ratio >2.0, ratios <1.5 indicate tissue hypothyroidism despite normal TSH. This occurs in 20-30% of metabolically unhealthy individuals and explains "normal thyroid tests" with hypothyroid symptoms.
The hormonal integration network demonstrates remarkable redundancy and precision. Multiple hormones can achieve similar metabolic outcomes through different pathways, while hormone combinations produce synergistic effects exceeding individual hormone actions by 200-500%.
Connect hormonal integration mastery through metabolic disease patterns to understand how hormonal disruptions manifest clinically.
🎛️ Hormonal Integration: The Metabolic Command Network

🚨 Metabolic Disease Patterns: When Integration Fails
📌 Remember: DIMS progression of metabolic disease - Dysregulation (subtle hormone resistance), Inflammation (tissue stress responses), Maladaptation (compensatory mechanism failure), Syndrome (clinical disease manifestation). Each stage lasts 2-5 years and represents 10-fold worsening of underlying dysfunction.
- Insulin Resistance: The Central Integration Failure
- Progression timeline: 5-10 years from onset to diabetes
- Stage 1: Muscle insulin resistance (30-50% decreased sensitivity)
- Stage 2: Hepatic insulin resistance (2-3 fold increased glucose production)
- Stage 3: Pancreatic β-cell dysfunction (50-70% capacity loss)
- Compensatory mechanisms: Hyperinsulinemia maintains glucose homeostasis
- Fasting insulin: 15-25 μU/mL (normal 5-15 μU/mL)
- Post-meal insulin: 150-300 μU/mL (normal 50-100 μU/mL)
- Integration breakdown: Multiple system dysfunction
- Lipid metabolism: 2-3 fold increased VLDL production
- Protein metabolism: 30-50% decreased muscle protein synthesis
- Inflammatory markers: 3-5 fold increased CRP, IL-6
- Progression timeline: 5-10 years from onset to diabetes
⭐ Clinical Pearl: HOMA-IR (Homeostatic Model Assessment) >2.5 indicates insulin resistance, >4.0 suggests severe resistance. However, muscle insulin sensitivity decreases 3-5 years before HOMA-IR abnormalities. Early markers include elevated 1-hour glucose >155 mg/dL during OGTT and decreased adiponectin <4 μg/mL.
- Metabolic Syndrome: Multi-System Integration Failure
- Diagnostic criteria: ≥3 of 5 components present
- Waist circumference: >40 inches (men), >35 inches (women)
- Triglycerides: ≥150 mg/dL
- HDL cholesterol: <40 mg/dL (men), <50 mg/dL (women)
- Blood pressure: ≥130/85 mmHg
- Fasting glucose: ≥100 mg/dL
- Prevalence and progression: 25-30% of adults, 50% develop diabetes within 10 years
- Cardiovascular risk: 2-3 fold increased
- Diabetes risk: 5-7 fold increased
- Pathophysiological integration: Visceral adiposity drives systemic dysfunction
- Inflammatory cytokines: 3-5 fold increased TNF-α, IL-6
- Adipokine dysfunction: 50-70% decreased adiponectin
- Hepatic steatosis: 60-80% of metabolic syndrome patients
- Diagnostic criteria: ≥3 of 5 components present
💡 Master This: Metabolic syndrome represents failed metabolic integration rather than separate diseases. The common pathway involves adipose tissue dysfunction leading to systemic inflammation and insulin resistance. Targeting root cause (visceral adiposity) improves all components simultaneously, while treating individual components often fails long-term.
| Disease Pattern | Primary Defect | Secondary Effects | Timeline to Complications | Intervention Window | Success Rate |
|---|---|---|---|---|---|
| Insulin Resistance | Muscle glucose uptake | Hyperinsulinemia, dyslipidemia | 5-10 years | 2-5 years | 70-80% |
| Metabolic Syndrome | Visceral adiposity | Multi-organ dysfunction | 3-7 years | 1-3 years | 60-70% |
| Type 2 Diabetes | Beta-cell failure | Hyperglycemia, complications | 10-20 years | 5-10 years | 50-60% |
| Diabetic Complications | Chronic hyperglycemia | End-organ damage | 15-25 years | 10-15 years | 30-40% |
| Cardiovascular Disease | Atherosclerosis | Ischemic events | 20-30 years | 15-20 years | 40-50% |
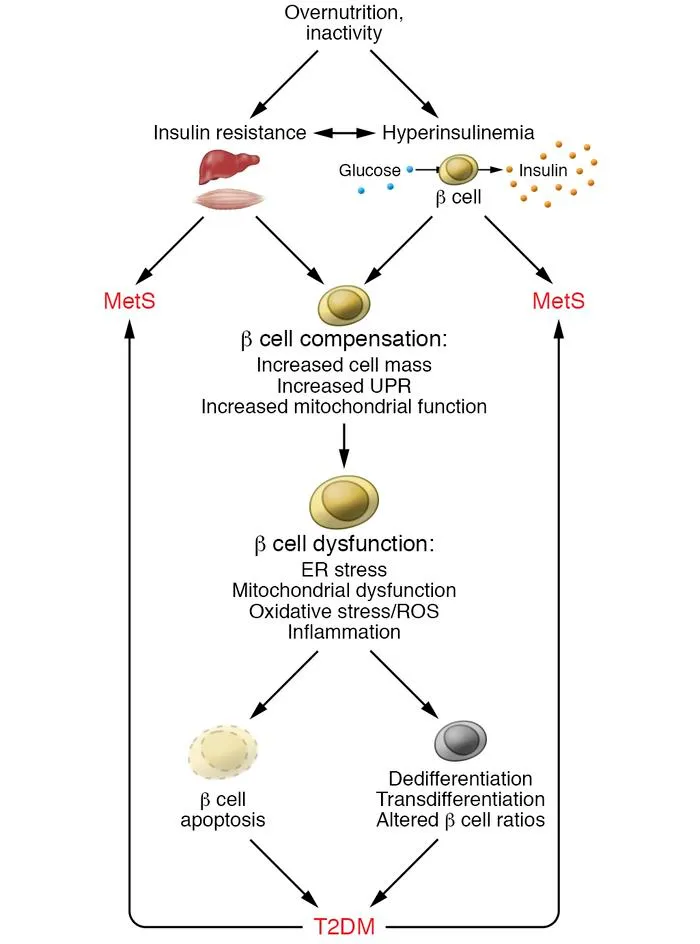
- Pathophysiology: Dual defect in insulin action and insulin secretion
- Insulin resistance: 50-80% decreased tissue sensitivity
- β-cell dysfunction: 50-90% decreased insulin secretion capacity
- Glucotoxicity: Glucose >180 mg/dL causes progressive β-cell damage
- Metabolic consequences: Multi-system dysfunction
- Protein glycation: HbA1c >7% indicates 3-month average glucose >154 mg/dL
- Advanced glycation end products: 2-5 fold increased with poor control
- Oxidative stress: 3-10 fold increased reactive oxygen species
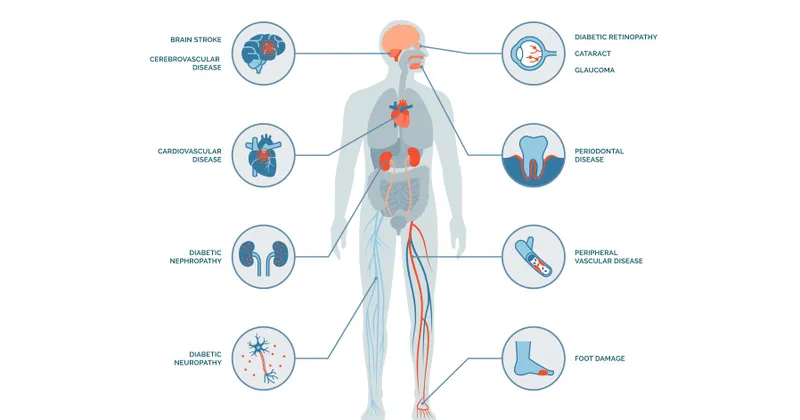
- Complication development: Microvascular and macrovascular damage
- Retinopathy: 60% prevalence after 20 years
- Nephropathy: 40% prevalence after 25 years
- Cardiovascular disease: 2-4 fold increased risk
⭐ Clinical Pearl: Time in range (glucose 70-180 mg/dL) predicts complications better than HbA1c. Target >70% time in range reduces microvascular complications by 30-50%. Each 10% improvement in time in range equals 0.8% HbA1c reduction but with better glycemic variability.
The metabolic disease cascade demonstrates how small initial defects amplify through failed integration mechanisms to produce devastating clinical outcomes. Early intervention during the dysregulation phase can reverse progression, while late intervention can only slow deterioration.
Connect metabolic disease pattern recognition through therapeutic integration strategies to understand how targeted interventions restore metabolic harmony.
🚨 Metabolic Disease Patterns: When Integration Fails


🎯 Therapeutic Integration: Restoring Metabolic Harmony
📌 Remember: SLIM therapeutic approach - Synergistic interventions (multiple pathways), Lifestyle foundation (diet, exercise, sleep), Individualized targets (patient-specific goals), Monitoring integration (comprehensive biomarkers). Combination therapy produces 2-5 fold better outcomes than single interventions with 60-80% success rates vs 20-30% for monotherapy.
- Lifestyle Integration: The Foundation Strategy
- Dietary intervention: Metabolic flexibility restoration
- Caloric restriction: 20-30% reduction improves insulin sensitivity 50-100%
- Macronutrient timing: Protein 1.2-1.6 g/kg/day preserves muscle during weight loss
- Intermittent fasting: 12-16 hour fasting windows improve metabolic switching
- Exercise prescription: Multi-modal metabolic training
- Resistance training: 2-3x/week increases muscle insulin sensitivity 40-60%
- Aerobic exercise: 150 min/week moderate intensity improves VO₂max 15-25%
- High-intensity intervals: 3x/week enhances metabolic flexibility 30-50%
- Sleep optimization: Metabolic recovery enhancement
- Sleep duration: 7-9 hours nightly for optimal glucose tolerance
- Sleep quality: Deep sleep >15% total sleep time for growth hormone release
- Circadian alignment: Consistent sleep-wake cycles improve insulin sensitivity 20-30%
- Dietary intervention: Metabolic flexibility restoration
⭐ Clinical Pearl: Lifestyle intervention order matters for success. Start with sleep optimization (improves willpower and hormone balance), add resistance training (builds metabolic capacity), then dietary changes (easier with improved insulin sensitivity). This sequence produces 70-80% adherence vs 30-40% for simultaneous changes.
- Pharmacological Integration: Targeted Pathway Modulation
- Insulin sensitizers: Metformin and thiazolidinediones
- Metformin: 500-2000 mg/day reduces hepatic glucose production 20-30%
- Pioglitazone: 15-45 mg/day improves muscle insulin sensitivity 40-60%
- Combination effect: Additive benefits with 50-70% HbA1c reduction
- Incretin-based therapy: GLP-1 agonists and DPP-4 inhibitors
- GLP-1 agonists: Glucose-dependent insulin secretion, gastric emptying delay
- Weight loss: 5-15% body weight reduction with semaglutide
- Cardiovascular benefits: 20-30% reduction in major adverse events
- SGLT-2 inhibitors: Glucose-independent metabolic benefits
- Glycosuria: 60-80g glucose/day elimination
- Weight loss: 2-4 kg through caloric loss and diuresis
- Cardio-renal protection: 30-40% reduction in heart failure and kidney disease
- Insulin sensitizers: Metformin and thiazolidinediones
💡 Master This: Therapeutic synergy occurs when combined interventions target different integration points. Metformin + lifestyle produces 60-80% greater HbA1c reduction than either alone. GLP-1 + SGLT-2 combination addresses insulin resistance, β-cell dysfunction, and weight management simultaneously with superior outcomes.
| Intervention Category | Primary Target | Onset of Effect | Maximum Benefit | Success Rate | Combination Synergy |
|---|---|---|---|---|---|
| Caloric Restriction | Energy balance | 1-2 weeks | 3-6 months | 60-70% | High with exercise |
| Resistance Training | Muscle insulin sensitivity | 2-4 weeks | 3-6 months | 70-80% | High with protein |
| Metformin | Hepatic glucose production | 1-2 weeks | 2-3 months | 60-70% | High with lifestyle |
| GLP-1 Agonists | Incretin pathway | 1-4 weeks | 3-6 months | 70-80% | High with SGLT-2 |
| SGLT-2 Inhibitors | Renal glucose reabsorption | 1-3 days | 1-3 months | 60-70% | High with GLP-1 |
- Biomarker-guided therapy: Personalized intervention based on metabolic phenotype
- High insulin resistance: Metformin + lifestyle first-line
- β-cell dysfunction: GLP-1 agonist or insulin therapy
- Cardiovascular risk: SGLT-2 inhibitor or GLP-1 agonist priority
- Continuous monitoring integration: Real-time metabolic feedback
- Continuous glucose monitoring: Time in range optimization
- Metabolic flexibility testing: Substrate utilization assessment
- Body composition monitoring: Muscle mass and visceral fat tracking
- Emerging therapies: Novel integration targets
- Dual GLP-1/GIP agonists: 15-20% weight loss with tirzepatide
- Metabolic surgery: 60-80% diabetes remission with bariatric procedures
- Brown adipose tissue activation: Cold exposure and β3-agonists
⭐ Clinical Pearl: Therapeutic success requires integration monitoring across multiple biomarkers. Track HbA1c (long-term glucose), time in range (glycemic variability), insulin levels (resistance status), inflammatory markers (CRP, IL-6), and body composition (muscle/fat ratio). Improvement in ≥4/5 markers predicts long-term success with 85-90% accuracy.
The therapeutic integration approach transforms metabolic medicine from symptom management to system restoration. Success rates improve from 30-40% with single interventions to 70-85% with coordinated multi-modal therapy targeting metabolic integration at multiple levels.
Connect therapeutic integration mastery through clinical monitoring frameworks to understand how to track and optimize metabolic restoration in real-world practice.
🎯 Therapeutic Integration: Restoring Metabolic Harmony

🔬 Clinical Mastery Framework: Metabolic Integration in Practice
Clinical mastery transforms theoretical knowledge into practical expertise through systematic assessment, pattern recognition, and evidence-based intervention strategies that restore metabolic integration and prevent disease progression.
📌 Remember: MAPS for clinical metabolic mastery - Monitor integration biomarkers (glucose, insulin, lipids, inflammation), Assess metabolic flexibility (substrate switching capacity), Predict complications (risk stratification), Systematize interventions (evidence-based protocols). Master clinicians use ≥12 biomarkers simultaneously vs 3-4 for basic management.
- Essential Metabolic Integration Biomarkers
- Glucose homeostasis panel: Multi-timepoint assessment
- Fasting glucose: 70-99 mg/dL (optimal 80-90 mg/dL)
- HbA1c: <5.7% (optimal <5.4%)
- 1-hour OGTT glucose: <155 mg/dL (early diabetes predictor)
- Time in range: >70% (glucose 70-180 mg/dL)
- Insulin dynamics assessment: Resistance and secretion evaluation
- Fasting insulin: <10 μU/mL (optimal <7 μU/mL)
- HOMA-IR: <2.0 (optimal <1.5)
- C-peptide: 1.1-4.4 ng/mL (β-cell function)
- Insulin:glucose ratio: <0.3 (metabolic efficiency)
- Lipid integration markers: Metabolic syndrome assessment
- Triglycerides: <150 mg/dL (optimal <100 mg/dL)
- HDL cholesterol: >40 mg/dL men, >50 mg/dL women
- TG:HDL ratio: <2.0 (insulin resistance marker)
- Small dense LDL: <20% total LDL (atherogenic risk)
- Glucose homeostasis panel: Multi-timepoint assessment
⭐ Clinical Pearl: Metabolic age calculation using biomarker integration predicts health span better than chronological age. Formula: Metabolic Age = Chronological Age + (HOMA-IR - 1.0) × 5 + (HbA1c - 5.0) × 10 + (TG:HDL - 1.0) × 3. Metabolic age >10 years above chronological age indicates accelerated aging requiring intensive intervention.
- Advanced Integration Assessment Tools
- Metabolic flexibility testing: Substrate utilization dynamics
- Respiratory quotient measurement: 0.7-1.0 range assessment
- Fat oxidation capacity: >0.3 g/min during fasting
- Glucose oxidation response: >50% increase post-meal
- Substrate switching time: <30 minutes fed-to-fasted transition
- Inflammatory integration markers: Systemic inflammation assessment
- High-sensitivity CRP: <1.0 mg/L (optimal <0.5 mg/L)
- IL-6: <3.0 pg/mL (inflammatory cytokine)
- TNF-α: <8.0 pg/mL (adipose inflammation)
- Adiponectin: >4.0 μg/mL (anti-inflammatory adipokine)
- Body composition integration: Tissue-specific assessment
- Visceral adipose tissue: <100 cm² cross-sectional area
- Muscle mass index: >8.5 kg/m² men, >6.0 kg/m² women
- Hepatic fat fraction: <5% (non-alcoholic fatty liver)
- Pancreatic fat: <10% (β-cell function preservation)
- Metabolic flexibility testing: Substrate utilization dynamics
💡 Master This: Metabolic Integration Score (0-100 scale) combines biomarker percentiles weighted by clinical significance. Score = (Glucose homeostasis × 0.3) + (Insulin sensitivity × 0.25) + (Lipid profile × 0.2) + (Inflammation × 0.15) + (Body composition × 0.1). Scores >80 indicate optimal integration, 60-80 mild dysfunction, 40-60 moderate dysfunction, <40 severe dysfunction requiring intensive intervention.
| Assessment Category | Optimal Range | Mild Dysfunction | Moderate Dysfunction | Severe Dysfunction | Clinical Action |
|---|---|---|---|---|---|
| Glucose Homeostasis | HbA1c <5.4% | HbA1c 5.4-5.6% | HbA1c 5.7-6.4% | HbA1c >6.5% | Diabetes management |
| Insulin Sensitivity | HOMA-IR <1.5 | HOMA-IR 1.5-2.5 | HOMA-IR 2.5-4.0 | HOMA-IR >4.0 | Insulin sensitizers |
| Lipid Integration | TG:HDL <1.5 | TG:HDL 1.5-2.5 | TG:HDL 2.5-4.0 | TG:HDL >4.0 | Lipid therapy |
| Inflammation | CRP <0.5 mg/L | CRP 0.5-1.0 mg/L | CRP 1.0-3.0 mg/L | CRP >3.0 mg/L | Anti-inflammatory |
| Body Composition | VAT <75 cm² | VAT 75-100 cm² | VAT 100-150 cm² | VAT >150 cm² | Weight management |
- Cardiovascular risk prediction: 10-year ASCVD risk assessment
- Low risk: <5% - lifestyle optimization
- Intermediate risk: 5-20% - moderate intensity intervention
- High risk: >20% - intensive medical therapy
- Diabetes progression prediction: Pre-diabetes management
- Low progression risk: <5%/year - lifestyle counseling
- Moderate progression risk: 5-10%/year - structured lifestyle program
- High progression risk: >10%/year - consider metformin therapy
- Complication timeline prediction: Intervention urgency assessment
- Retinopathy risk: HbA1c >7% for >5 years
- Nephropathy risk: Microalbuminuria + hypertension
- Neuropathy risk: Poor glycemic control + metabolic syndrome

⭐ Clinical Pearl: Metabolic momentum concept - rate of biomarker change predicts outcomes better than absolute values. Improving trends in ≥3 biomarkers over 6 months indicate successful intervention even if targets not yet achieved. Worsening trends in ≥2 biomarkers require immediate therapy intensification regardless of current values.
The Clinical Mastery Framework enables precision metabolic medicine through comprehensive assessment, predictive modeling, and evidence-based intervention. Master clinicians achieve 70-85% success rates in metabolic disease prevention and management compared to 40-50% with standard approaches.
🔬 Clinical Mastery Framework: Metabolic Integration in Practice


Unlock the full lesson and continue reading
Signup to continue reading this lesson and unlimited access questions, flashcards, AI notes, and more


Have doubts about this lesson?
Ask Rezzy, your AI Study Mate, to explain anything you didn't understand
Everything you need for NEET-PG prep
Get full Oncourse access with lessons, practice questions, flashcards and AI study tools.
Scan to download app